Quantifying The Value of Maintenance for Asset Management and Capital Planning
By Jeff Tuzik
On freight railroads, rail is generally the largest single asset, capital expenditure, and one of the primary costs. From a maintenance perspective, rail is subject to wear and defect development, both of which can be actively managed in a number of ways. From an accounting perspective, rail undergoes depreciation. This too, is a metric that can be managed. CSX is currently in the process of a years-long rail-life-extension initiative focused on quantifying the effects of various maintenance actions on rail life extension, as well as developing a more accurate model of rail depreciation that takes into account modern rail steels and maintenance techniques. By quantifying maintenance efforts from the smallest scale up to their effect on the asset-overview level, CSX has been able to make a strong business case for their maintenance approach, from budgeting to implementation.
Quantifying the Value of Grinding
While the value of rail grinding is easy to demonstrate, it can be difficult to quantify. But it is necessary to quantify in order to optimize maintenance spending. “Every maintenance action has to be justified, and the more data I have, the better I can justify a change to the maintenance program,” Daniel Hampton, CSX Manager of Contract Services, told those in attendance at the 2022 Wheel/Rail Interaction conference. Big-picture cost/benefit analyses look at rail life extension versus cost of maintenance implementation and ultimately the return on investment. There are a number of complicating factors, but this is the key metric, Hampton added.
Generally, there are three approaches to quantifying the effects of a proposed maintenance action or strategy. The first is to perform a scaled-down version of the maintenance in a test area and measure the results. While theoretically feasible, this approach has some drawbacks and limitations:
- The effects of the maintenance work may take years or decades to fully develop, depending on the MGT of the test area.
- It’s difficult to isolate variables in the test site, particularly as MGT/time spans increase.
Another approach to the cost/benefit analysis is to use existing wear and defect data trends to predict rail life extension. This method also has limitations in that the predictive model will be as accurate and granular as previously collected data, and, like establishing a test site, many variables and/or components may not be accounted for in historic data.
The final approach to quantifying a maintenance decision is to develop a simulation or model of rail life based on field data. A model like this can include wheel and rail profile data, steel hardness, MGT and traffic patterns, track geometry, and others. “This method allows you to isolate specific variables and get immediate feedback on changes to the maintenance program,” Hampton said. The first two techniques (field testing and trending off field data) remain relevant and valuable, as well, in that they can be used to validate and build confidence in the simulation.
Once the rail life extension has been modeled and validated, the next step is to convert those figures into cost savings. “The figure we’re looking at here is depreciation,” Hampton said. In simple terms, a maintenance action that increases rail life effectively decreases the yearly depreciation cost of the rail and postpones the date of rail replacement. Rail with the shortest life, such as track in sharp curves, will see the quickest and often most significant return on investment. The ROI presents as both shorter-term savings and future savings in terms of capital expenditure. Hampton noted, however, that the depreciation data that many railroads work with loses relevance if it isn’t kept up to date. “A modern ultra-premium steel has a very different depreciation curve than a rail steel installed 30 years ago,” he said. Yet in some cases, this kind of outdated depreciation data is being used to inform maintenance cost/benefit analyses.
Cost and Opportunity
As is the case on other freight railroads, rail and OTM represent CSX’s largest asset — making up $8.8 billion of its total assets. This means, for example, that a theoretical one-year rail life extension represents a $6.4-million annual depreciation reduction, Hampton said. In 2021, CSX’s depreciation costs across all lines totaled roughly $1.4 billion – meaning there is a great opportunity for savings in this part of the budget.
Part of realizing these savings is in activities managing depreciation rather than treating it as a (relatively) static figure. While other costs like labor and fuel are tightly managed, “depreciation tends to fly under the radar,” Hampton added.
Given these various levers (maintenance strategy, rail life extension, depreciation) to effect savings, CSX developed a program to compare the ROI of various maintenance strategies, and to develop a more accurate suite of rail depreciation values to inform future maintenance.
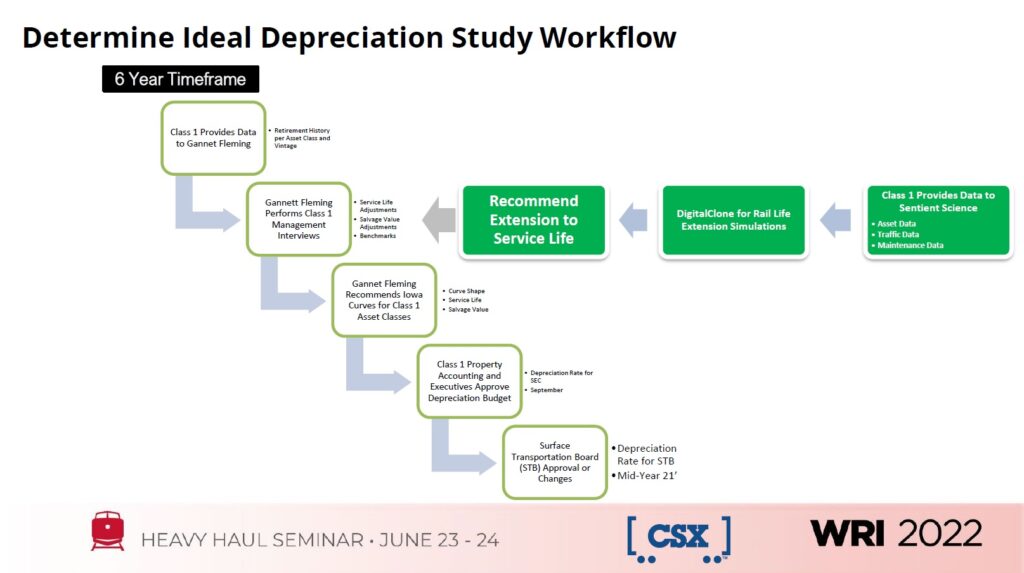
The general framework for developing depreciation values (see figure 1) involves an accounting firm gathering data from Class 1 railroads that includes service life, traffic data, maintenance practices, salvage value, as well as reporting from management regarding maintenance costs and service-life extension valuation. “It’s important to remember [in this case] that you’re talking to an accountant. You need to quantify your maintenance gains in terms of rail life,” Hampton said. This is where modeling and simulation data can provide another benefit in directly correlating maintenance efforts to dollars saved.
Simulation
The primary tool CSX uses for these simulations is DigitalClone for Rail. “This tool takes into account various fielddata inputs that are similar to what Vehicle/Track Interaction models use,” said Ankur Ashtekar, then Vice President-Product, at Sentient Science. (Note: Sentient Science’s rail business unit, which includes Sentient Science’s digital twins and economic modeling products, was acquired by Loram in January of 2023.)
The simulation also draws on materials data from lab studies, allowing for a robust model on which to test maintenance actions. The simulation can output data on wheel/rail profile evolution, contact patch evolution, localized vs global wear, interaction between natural wear and artificial wear (grinding), and many other variables that CSX is keen to monitor. “We’re able to see how every variable is affected by a maintenance strategy in real time, rather than waiting for years to get the whole picture,” Ashtekar added.

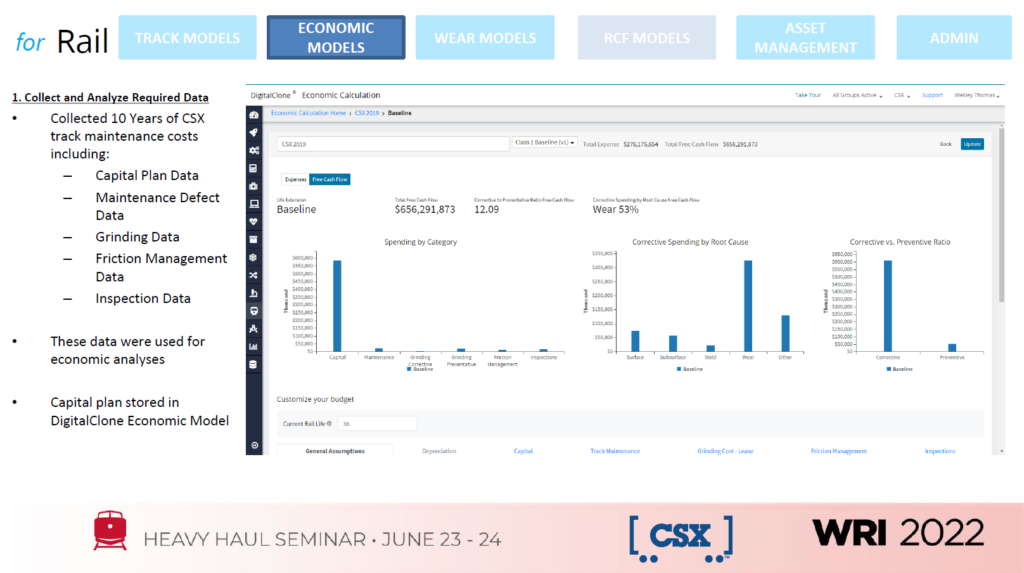
In addition to the physics-based simulation, DigitalClone has an integrated economic model as well. In building their rail life extension/maintenance model, CSX provided 10 years of economic data including:
- Capital planning data
- Maintenance and defect data
- Friction management data
- Inspection data
All these data are put into an economic model (see figure 2) that can be used in conjunction with the physics model to determine the actual investment cost, the effect on rail life, and ultimately the ROI of every action, Ashtekar said.
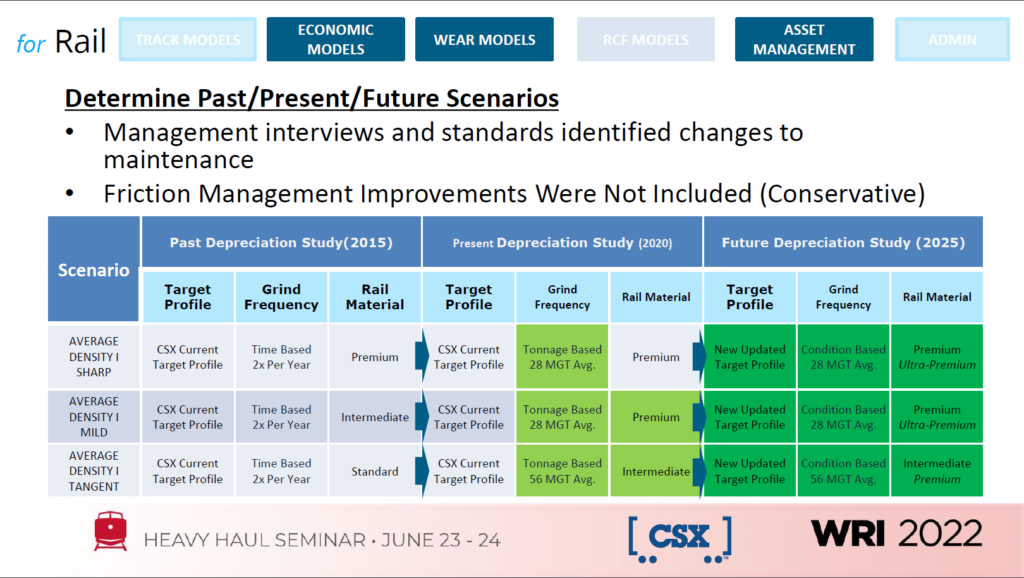
“Ideally we’d model every CSX asset possible,” he said. But for the scope of this program, CSX selected three sites representing the three main categories of track assets: sharp curves, mild curves, and tangents. Field data from these sites was used to build the physics model.

The next step was to collect data on CSX’s maintenance strategies and their improvements over time in order to build a more accurate depreciation model. One of the biggest changes CSX has made to their grinding strategy over the past five years is to move from a time-based approach (grinding biannually) to a tonnage-based approach. At the same time, rail material has been improved, with tangents moving from standard to intermediate hardness and mild curves moving from intermediate to premium, Ashtekar said. Sharp and mild curves are also in the process of moving to ultra-premium steel — planned to occur in the next several years (see figure 3).
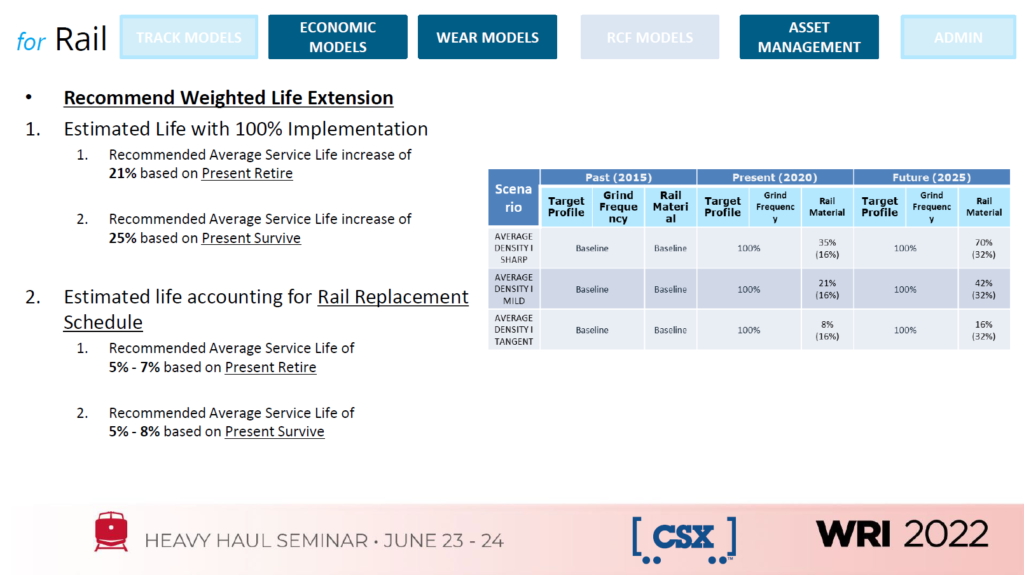
Analyses run with this data indicated a 21% increase in recommended average service life increase based on retirement criteria (percentage of capital replaced due to failure mode) and a 25% increase in average service life increase based on survival criteria (percentage of network represented by failure mode). These figures represent a projected 100% implementation of the maintenance strategy improvements CSX has developed over the past five years, Ashtekar said. Due to the reality of rail replacement scheduling, this is a fairly unrealistic number. Based on the current progress of rail replacement thus far, the figures come to an average service life increase of 7% and 8% based on retirement and survival criteria, respectively (see figure 4).

Once established, these physics and economics models remain valuable tools moving forward. As new data comes in, the physics and economics models can be updated so that changes in the field are always represented in terms of quantifiable life extension and dollars-saved.
Between the first study in 2015 and the most recent study in 2020, CSX has implemented a number of changes (rail replacement, maintenance strategy refinement, top-of-rail friction modifier implementation) that are beneficial to the overall health of the system. These improvements take time to implement, and can take much more time to show an ROI; so, one of the biggest benefits afforded by simulation software like DigitalClone is the ability to get that figure immediately, and project it out into the future, CSX’s Dan Hampton said.
Over time, simulated data can be projected against collected field data. CSX plans to use this to help refine the simulations and build confidence in the various models they’ve developed for both management and external auditors.
As both physics and economics models become more sophisticated and granular, the importance of quantifying maintenance strategies in terms of their ROI has become more important. Common wisdom and best-practices have to be justified, and, in many cases, leave room for optimization. As simulations like those employed by CSX have shown, optimization of maintenance translates directly to money saved. As new maintenance strategies are put into practice and have time to mature, the data they deliver can in turn inform more refined future models, effectively creating a feedback loop of optimization. It will be interesting to see the results, years from now, of projects like these that are leveraging the advantages of advanced simulations.

Jeff Tuzik is Managing Editor of Interface Journal.
This article is based on presentations made at the 2022 Wheel/Rail Interaction Conference.

