Using Performance-Based Assessment of Reserve Gauge Strength to Enhance Tie-Replacement Planning
By Robert Madderom
Technology has changed the ways in which railroads plan most of their maintenance programs over the past 30 years. But one aspect of maintenance planning has remained static. Railways still select ties for replacement and plan a significant portion of their maintenance budgets based on visual inspections by walking tie inspectors.
Modern technology is used to monitor track and component conditions in order to effectively plan and budget for maintenance requirements. Laser and optical systems are used to measure wheel and rail wear. Ultrasonic technologies can detect rail flaws before they mature. But in 150 years of railroading, little has changed in terms of crosstie renewal. Crosstie replacement and spot maintenance programs are based on visual inspections, field experience, and (on some railroads) tagging and classification via various software tools. But the overall assessment is still based on visual inspection. Because of this, inspections are more subjective than they should be, and judgment by inspectors can vary by as much as 20%. These shortcomings can have a major impact on the goal of any crosstie evaluation program, which is to meet the track class requirements and to do so by maximizing the economic value of every tie in the budget.
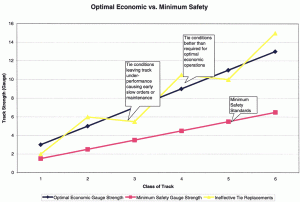
Figure 2 illustrates the concept of the Optimal Economic Track Condition. Clearly, railroads cannot effectively operate with all of their track at minimum safety standards, represented here by the pink line. The figure also indicates that Optimal Track Condition is significantly higher at higher track classes, tonnage and speed, and with a higher factor of safety. The yellow line represents theoretical ineffective tie replacements. If too many ties are replaced in this Class 2 track, budget dollars are wasted. If too few ties are replaced, the track will under-perform, requiring additional monies to achieve the desired condition — again, a poor use of budget.
Simply put, removing a tie too early results in lost value; leaving behind too many weak ties requires additional spending. For heavy-tonnage, high-speed tracks, the “get ‘em all” approach makes sense, because of the need to ensure that the track condition can safely support the traffic and tonnage. On lower track classes, the process of deciding how many and which ties should be replaced is more challenging.
Since most railways devote 25% – 30% of their maintenance budgets to tie activities, the value of optimizing a tie renewal program can be significant. Part of the problem that railways face, however, is that they have no way to measure the lost value of a tie that is replaced too early. Even a 5% misallocation of the tie budget can represent a significant loss of long-term value. Every tie that is inserted is an investment that needs to be utilized correctly in order to obtain the optimal economic benefit from limited budgets.
Technology Can Help
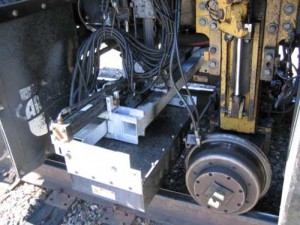
Over the past 20 years, Gage Restraint Measurement Systems (GRMS) have been used to quantify the reserve track gauge strength — a key parameter in the selection of crossties for replacement or maintenance. GRMS was originally developed as an alternative standard for minimum safety. The Track Safety Standards Part 213.110 outlines the use of this standard as an alternative to the requirements of “tie and fastener counting” sections (213.109 and 213.127).
As a minimum safety standard, GRMS has generally been thought of as something to use in lower track classes where the railroad is trying to limit tie expenditures. The performance-based GRMS method of assessment can do that quite effectively. But more can be done.
Almost 100,000 miles of track are tested for gauge strength annually in North America, today. But only about 2% of the GRMS testing is used to support the alternative Part 213.110 standards. The remaining 98% is primarily used for short-term track maintenance. GRMS is not utilized to its full potential in terms of crosstie renewal programs.
Reserve gauge strength data has the potential to provide additional information to support and develop effective tie-replacement programs. The key measurement for such programs is “Gage Widening Projection” (GWP). GWP is a replacement for the “Gage Widening Ratio” (GWR) in the Part 213 track minimum safety standards, and is currently the best objective, performance-based measurement of the ability of ties and fasteners to hold gauge.
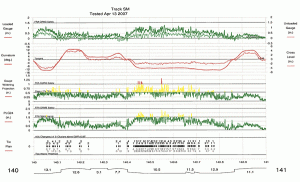
The strip chart shown in Figure 3a shows the measurements of unloaded and loaded gauge, curvature and cross level, and GWP and “Projected Loaded Gage” (PLG), which are both GRMS measurements. The bottom line on the chart represents crosstie counts selected on the basis of the measured reserve gauge-strength performance.
This is essentially a visual tie plan for one mile of track. The thresholds selected for this mile are: GWP> 0.85”, cluster lengths of 4 or more ties in a row exceeding the GWP threshold, and an estimated replacement rate of 33% within the clusters that are found. This plan was developed on a Class 4 track for the purpose of improving short-term track strength condition. Under this plan, minimal tie maintenance was required.
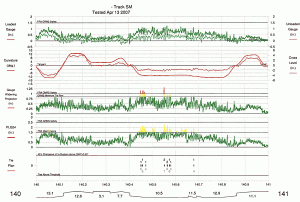
Figure 3b illustrates the same track with a major tie replacement plan. This visual tie plan was developed around the following parameters: GWP > 0.525” (which is well below the minimum safety standard), clusters of 3 or more ties (to focus in at short lengths of track that are weak), and a higher estimated replacement rate of 45% with the clusters. The Holland/Industrial Metrics Rangecam software program that was utilized provides full flexibility when it comes to all of these parameters. Obviously, much more track comes into requirements for replacement ties on the basis of the thresholds featured in figure 3b.
Both of the preceding models were purely theoretical and did not include any visual tie inspection component. The models were based on the common experience that significant detrimental track conditions in wood tie track are almost always associated with the need to replace crossties. To verify the findings, these concepts were taken into the field for evaluation against visual inspection. The inspection was conducted on class 3 and 4 track with curves of up to 6 degrees and annual tonnage of approximately 15 mgt.
After the completion of a track-strength evaluation of 57 track miles, the performance-based assessment was compared to a normal walking visual inspection. The railroad’s cluster length (4 ties in a row or more) and replacement percentage logic (45%) was input into the software, without knowing where to set the GWP threshold. During this trial, the approach was to back into the GWP threshold for this evaluation by matching up to the total tie counts generated from the tie inspector’s visual inspection.
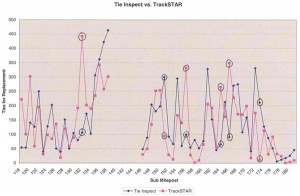
The railroad’s tie-replacement count, which was based on a tie inspector’s visual inspection, was 7,981 ties over 57 miles of Class 4 track. With this information, the GWP threshold was modified in the software until we got close to that total tie count for the 57 track miles. Figure 4 shows the 57 track miles in question laid out in a comparison on a mile-by-mile basis. As expected, the software’s ties counts were very close to those of the railway’s tie counts over many miles. But the counts varied significantly within several miles.
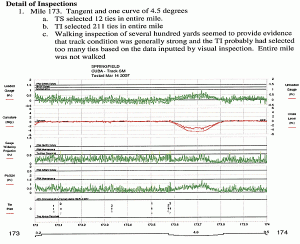
In order to sort out the differences, the data from the software was taken to the field. Fifteen track segments were inspected. Figure 5a shows mile 173 of the track that is quite strong, based on the relatively low GWP readings throughout most of the mile. (“TS” represents performance-based TrackSTAR® data generated by the GRMS system. “TI” represents the visually assessed condition, and tie counts generated by Zeta-Tech Associates, Inc.’s TieInspect® program.) The chief tie inspector concluded that although this section of track exhibited excellent reserve gauge strength, the tendency of inspectors who are grading ties is to sometimes alter their grading standards when they have walked long lengths of track without classifying ties as “failed” or “weak”. This might have accounted for part of the 211 ties selected by the visually based method.
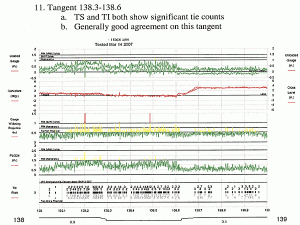
A walking inspection was performed on the entire length of the tangent section at Site 11, between MP 138.3 and 138.6 (see Figure 5b). As Figure 5b indicates, there was good agreement on tie counts between the visual inspection and the performance-based assessment. The Figure shows that there was a lot of weak track in this tangent segment. The 3-degree curve beginning at 138.6 is clearly stronger than the preceding tangent and 1-degree curve, indicating that the 3-degree curve had undergone maintenance prior to the inspection.
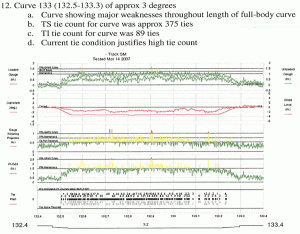
The 3-degree curve at site 12 was also chosen for further inspection because there were significantly different tie counts produced by the two methods (see Figure 5c). A walking inspection was performed on the entire curve, about 3/4 miles in length. The chief tie inspector agreed that the GRMS, performance-based tie count at 375 ties was much closer to what was actually required than the 89 ties counted by the standard, visual method. It was not clear why the visual tie count in this curve was so low.
What can we infer from the field inspection of 15 sites within 57 miles?
One conclusion is that there is still far too much subjective variability in the tie counts by trained walking inspectors. Reducing this variability is key to improving tie renewal programs and effective use of the budget. Another conclusion is that the performance-based track-strength assessment provided by GRMS, at the very least, provides quantitative data that can be used to correlate and improve the information derived from visual inspection. Clearly, there are weak tie conditions that are not effectively found by inspectors who are walking 5 miles of track or more per day.
Additionally, there is good evidence that performance-based assessment generally selected fewer ties in tangents and more ties in curves. This is contrary to the general tendency of walking inspectors, who tend to select more ties in curved track than in tangent.
Performance-based strength assessment can enhance and improve the tie-replacement decision process, and has the potential to improve safety and optimize the value received from available tie budgets. Of course, visual inspection is still required to identify tie conditions that are not strictly related to gauge strength, but still call for replacement. Nonetheless, performance-based assessment provides the potential to compare or prioritize subdivisions or track segments for program work.
In the future, the combination of performance-based track strength assessment coupled with developing “automated visual inspection” or “machine vision” technologies may hold the key to eliminating the subjective walking inspections that have been in place, more or less, since the dawn of railroading.
![]()
Robert Madderom is Vice President and General Manager of the Holland LP’s Railway Measurement Systems & Services Division.

