Management of the Wheel/Rail Contact Interface in Heavy-Haul Operations (Part 1 of 2)
By Huimin Wu and Semih Kalay • October, 2009
Wear and rolling contact fatigue (RCF) of rails and wheels are common problems under heavy-haul operations. Increasing axle loads can increase the capacity of a railway system, but also can increase the stress state of the system. A root cause of RCF and excessive wear on rails and wheels is the high energy input into the wheel/rail interface, indicated by high levels of contact stress, tangential forces and creepages (1, 2). Reducing the energy input into the wheel/rail interface is a key strategy to reducing wear and RCF.
Wheel/rail contact conditions significantly influence vehicle performance, wheel/rail wear and the formation of RCF. To manage the wheel/rail interface, wheel/rail profiles and wheel/rail contact conditions must be measured and analyzed, and wheel/rail maintenance practices must be carefully controlled.
A wheel/rail contact interface management technique that has been developed and applied in North American heavy-haul service includes three major elements:
• Development of an automated wheel/rail contact inspection system for conducting system-wide wheel/rail contact inspection.
• Identification of undesired wheel/rail contact conditions causing vehicle performance problems and excessive wear and RCF on both wheels and rails.
• Guidance for wheel and track maintenance to correct the identified wheel/rail contact problems.
This technique applies the fundamentals of wheel/rail contact computation to the evaluation of wheel/rail contact from a systematic point of view.
Wheel/Rail Contact Inspection System
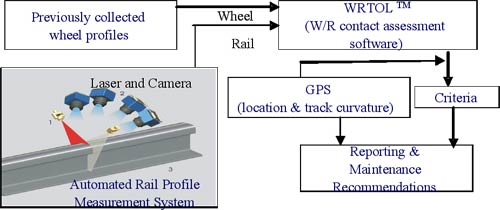
The Transportation Technology Center, Inc. (TTCI) developed an automated wheel/rail contact inspection (WRCI™) system (3) under the Association of American Railroads’ Strategic Research Initiatives Program. Figure 1 illustrates the data measurement and processing flow of the WRCI™ system. This measurement system can be installed on a railway car, as shown in Figure 2. The WRCI™ can perform real-time assessment of wheel/rail contact conditions, using rail profiles that are measured by the system and compared to pre-collected wheel profiles from more than 200 representative wheelsets. The pre-collected wheel profiles, which are drawn from cars that normally travel over the route being inspected, have varying degrees of wear. A GPS system is used to correlate the rail measurements to the track locations. The operating speed is proportional to the measurement interval and currently reaches 70 km/hr with a measurement interval of 3 meters. Track curvature, wheel loads and track gauge are taken into consideration in the assessment. The likely effects of wheel/rail contact on vehicle performance are predicted based on assessment results. Wheel/rail contact conditions can be quickly assessed in order to provide an overall view of wheel/rail contact conditions on a system and determine the need for rail reprofiling.
In the WRCI™ system, the wheel/rail contact parameters are assessed by placing each wheelset profile that is stored in the database on each measured pair of rails. The wheel profiles are moved laterally, relative to the rail profile, and the program calculates the following contact parameters:
• Contact positions on each rail.
• Maximum contact angle.
• Rolling radius difference on curves.
• Effective conicity on tangent track.
• Contact conformity.
• Contact stress.
Contact position is particularly important, as it detects the contact position on the low rail in curves, and the risk of rail rollover derailment. Figure 3 shows that 38% of the wheels used in the inspection contacted the inner rail on a curve at a point more than 55 mm from the rail gauge. The WRCI™ system produces an exception alert if this contact pattern continues for a specified distance — 30 meters, in this instance
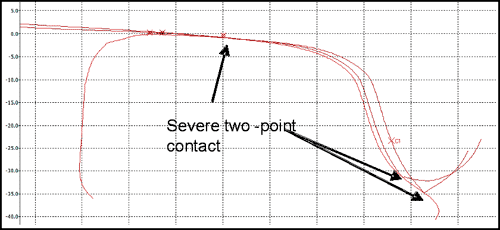
The maximum contact angle relates to the risk of flange climb derailment. A low contact angle can be caused by rail rotation due to weak track or fastening system. A low contact angle can also be caused by wheels contacting rail at the rail lip, as shown in Figure 4, which can lead to poor vehicle curving performance.
Contact conformity and rolling radius difference provide an indication of vehicle curving performance under prevailing track conditions. Contact conicity indicates vehicle lateral stability at high speed. Contact stress and its distribution provide an indication of wear and risk of RCF.
Exception reports are produced for the track sections (specified in both distance and GPS coordinates) where pre-defined criteria have been exceeded and where distances exceed user-defined lengths. Information on track curvature and measured rail gauge are also included in the exception report.
Tangent Track Inspection
The WRCI™ system was used to examine how rail profiles and track conditions contribute to hunting under one type of loaded grain car on specific lines. The system showed that wheels on some of these cars were worn to shapes that produce high contact conicities when contacting certain rail profiles.
Wheel/Rail contact conicity (λ) is defined by Equation: λ = ΔR/2y (4), where ΔR is the rolling radius difference of two wheels on an axle and y is the wheelset lateral shift. Higher values of conicity lead to a higher risk of vehicle lateral instability. Wheel/rail contact conicity is affected by wheel/rail profile shapes that affect the value of ΔR and the clearance between wheel flange and the rail gauge, which affects the value of y.
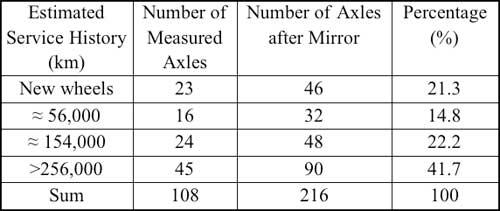
Table 1 shows the distribution of wheel profiles used to assess the measured rail profiles. The wheel profiles, which were taken from loaded grain cars (with more than 256,000 kilometers of service) that demonstrated lateral instability, demonstrated a tendency to produce higher contact conicities when contacting certain rail profile shapes. Other wheel profiles were taken from other 286k grain cars; service mileages were estimated from their service records.
Because of the asymmetric wear on some of these wheelsets (and the possibility that they could contact either rail depending on the cars’ orientation), the 108 measured wheelsets were mirrored to produce a database with a total of 216 wheelsets.
Inspection Results
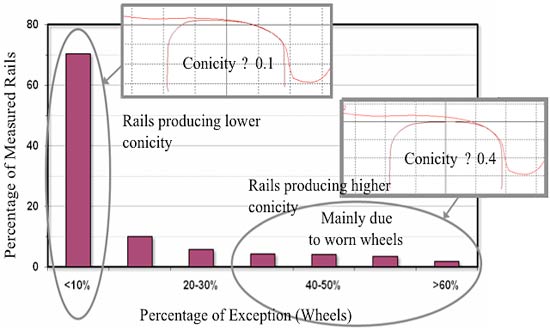
An inspection identified the track sections and rail profiles that produced high contact conicities when contacting certain worn wheel profiles. Figure 5 shows the inspection results for 30.4 km of tangent sections of a heavy haul line. The nominal operating speed on this line is 88 – 112 km/hour, depending on the car types. About 25,000 pairs of rail profiles were measured on the tangent track sections. The Y-axis of Figure 5 indicates the percentage of total rail pairs measured in the tangent track sections. The X-axis denotes the percentage of wheels that exceeded the conicity threshold limit of 0.35, which was selected based on loaded car lateral instability tests conducted at TTC. (The tests concluded that the wheelset conicity of the grain car must be in excess of approximately 0.4 to develop loaded car lateral instability within prevailing operating speeds (5).)
In Figure 5, the bar of <10% indicates that 70% of the rails contacting the wheels in the database caused less than 10% of the wheels to exceed the 0.35 threshold conicity value. In other words, more than 90% of the wheels (new and worn) contacting 70% of the rails produced conicity values below 0.35.
Only about 13% of the measured rail profiles (summation of last four bars circled in Figure 5) in this section of track contacting the wheels in the database caused more than 30% of wheels (last four bars in Figure 6 notated from > 30% to >60%) to exceed the 0.35 threshold conicity value. Therefore, these 13% of rails had a tendency to induce loaded car lateral instability.
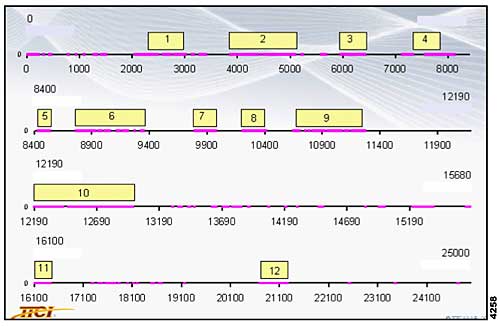
Figure 6 shows the locations of the rails that produced higher contact conicities in this section of track. The distance axis shows the measurement numbers in sequence, with a distance interval of 2 meters. The dots show all rails that produced higher contact concities. The numbered blocks show the track sections where a large percentage of the rails produced conicities above 0.35. Subsections 7, 8, 10, and 12 are likely in need of maintenance, because they had a high percentage of exceptions over longer distances (see Table 2).
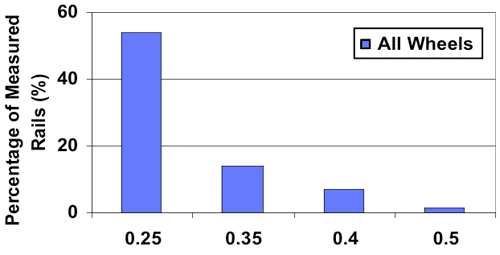
Figure 7 shows the percentage of all measured rail profiles that exceed the conicity threshold values between 0.25 and 0.5 for the same section of tangent track using the 30% wheel exceedance criterion. The results give an overall view of contact conicity of this track.
References
1) Johnson, K.L., Contact Mechanics, Cambridge University Press, 1985.
2) Burstow, M.C., “Whole Life Rail Model Application and Development for RSSB — Continued Development of an RCF Damage Parametre,” Rail Standard and Safety Board, London, UK.
3) Wu, H., Thompson, R., Lundberg, W., and Hou, K., “Development of an Automated Assessment System for Wheel/Rail Contact Condition Inspection,” Proceedings of 7th World Congress on Railway Research, June 2006.
4) Guidelines to Best Practices for Heavy Haul Railway Operations – Wheel and Rail Interface Issues, International Heavy Haul Association, May 2001.
5) Tournay, H., Wu, H., and Wilson, N., “Investigation into the Root Causes for Loaded Hunting,” Research Report, R-995, Association of American Railroads, Transportation Technology Center, Inc., November 2008.

