Applying Quality Concepts to the Wheel/Rail Interface (Part 3 of 3)
By Stephen S. Woody
Part 1 of this article examined the results of a six-sigma project that Norfolk Southern initiated to improve the efficiency of its grinding program. Part 2 illustrated some the data analysis-related problems that NS experienced and learned from during other six-sigma projects. Part 3 describes two ideas for prioritizing and resolving wheel/rail interface issues.
If you follow the trends in the quality industry, you consistently see two underlying issues that can affect wheel/rail practitioners. The first issue is that the most important problem affecting a process is rarely properly identified and acted upon. The second issue is that when quality professionals do identify the proper action to take, they frequently cannot frame their recommendations in terms that cause their management to act upon those recommendations.
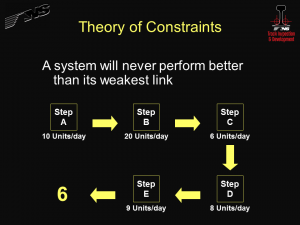
A branch of the quality field known as the theory of constraints can help to identify the most important problem in any process. The premise behind the theory of constraints is that a system is like a chain: it will never perform better than its weakest link. (The theory of constraints is really an extension of the Pareto Principal). Figure 1 shows a five-step process as an example of the mindset behind the theory of constraints. The number of units that can be produced per day is shown below each step. As the Figure indicates, the maximum number of units that the process can produce per day is 6 units because step C is the limiting factor, or the constraint.
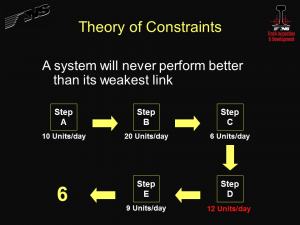
Assume that a quality improvement project increases the production of step D of the process to 12 units per day as shown in Figure 2.
However, the output of the process is still 6 units per day because the weakest link is still step C. Note that a great deal of time, money, and effort may have been spent on improving step D for no real benefit.
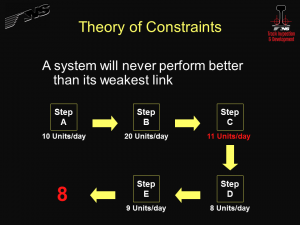
Now assume that a quality improvement project improves the output of step C of the process to 11 units per day as shown in Figure 3. Now the output of the process is 8 units per day because step D is now the new weakest link. If we want to improve our process output even more, we will now have to focus our efforts at step D. When the output of step D improves, step E will become the constraint.
Refer to Figure 1 and note that there are two possible courses of action to take depending on what the output of the process must be.
If 6 units a day is an acceptable process output, then steps A, B, D, and E must be consolidated or slowed down since they would otherwise be creating excessive in-process inventory, which wastes money and manpower. If 6 units per day is not an acceptable process output, then step C must be worked on to increase the process output to the desired level.
The above example consists of independent steps. Real-life processes rarely have independent steps and interactions between factors can be the system constraint.
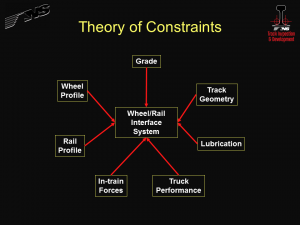
So, how does the theory of constraints apply to the wheel/rail interface? There is only one factor or one interaction between factors from the groups of variables listed in Figure 4 that is the weakest link that limits the performance of the wheel/rail interface.
The trick is to identify which factor is the weakest link. Bear in mind that the constraint may vary from line to line or from location to location on the same line. Also bear in mind that working on anything other than the weakest link does nothing to improve the strength of the whole chain.
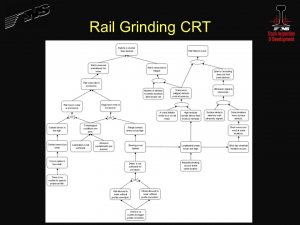
NS did not use a theory of constraints approach to the wheel/rail interface when the six sigma grinding project described in the first part of this series of articles was initiated. We chose to work on a portion of the “repair” process instead of working on the cause of the damage. Quality professionals would accuse of us of attempting to “repair” quality rather than to build in quality. Although NS did not use the theory of constraints approach to select the six sigma grinding project, we did use a theory of constraints tool called a Current Reality Tree (CRT) to help identify the important variables (see Figure 5).
As mentioned earlier, quality professionals frequently have problems getting management to act upon their recommendations. This is typically a communication problem; neither side is using the same language. Quality professionals speak in terms of defects and nonconformities while management speaks in the language of money. Wheel/rail practitioners mostly speak in the language of lateral forces, but we need to speak in the language of money if we want management to take action.
So how do we begin to speak in the language of money? One possible method is by developing ways to identify where we waste train energy. If we can measure the horsepower required to move a specific train from point A to point B and if we can calculate the ideal amount of energy it should have taken to move the same train from point A to point B, then we have the wasted energy that (primarily) went into damaging the wheels and track structure. Because that energy came from the locomotive, we can calculate the cost to generate that wasted energy. Now we have a cost that even the Finance Department can accept because it is an expense that immediately affects the income statement. We can also use a wasted energy approach to identify constraints by location and to help determine which of the factors from Figure 4 needs to be attacked.
There are several quality principles that wheel/rail practitioners can adopt to make our jobs easier: Use the data that is available. Analyze the data correctly by verifying the analysis assumptions. Fix the real problem by finding the constraint. And communicate in the only language that management understands: the language of money.
![]()
Stephen S. Woody is Manager, Track Inspection & Development, Norfolk Southern

