Examining the Role of Wheel/Rail Interaction in a Unit Train Derailment
by Jeff Tuzik

Derailments happen. The minor ones cause damage and disruption; the big ones make the news. While there are derailments attributed to a single vehicle or track cause, often, the cause is the result of a combination of vehicle- and track-related contributing factors, underscoring that vehicle/track interaction is a system.
George Fowler, who after a 30-year career in various engineering positions at Canadian National and another 20 years as a Specialist / Senior Investigator, Roadbed / Tracks / Signals / Rail, investigating derailments for the Transportation Safety Board of Canada, broke down one such derailment to help delegates at the 2024 Wheel/Rail Interaction Conference better understand the mechanics of wheel/rail interaction.
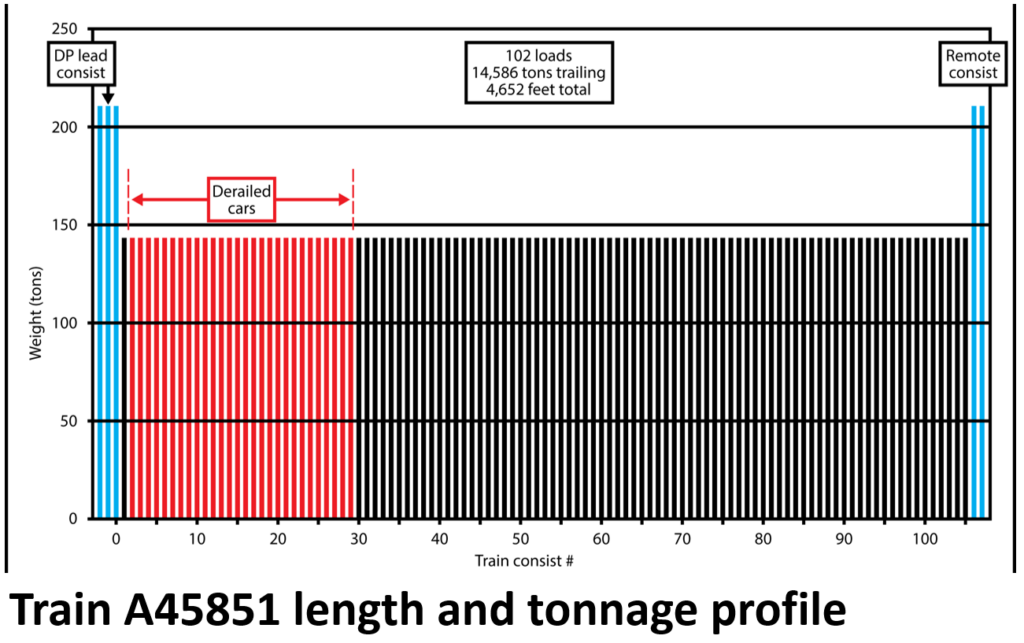
The Grey derailment occurred in 2016, in Canadian National’s Grande Cache Subdivision in Grey, Alberta. In total, 28 hopper cars loaded with frac sand derailed. The train (train A45851) was operating with distributed power — three locomotives on the head-end, and two on the rear-end. The rest of the consist was made up of 102 loaded covered hopper cars weighing ~142 tons each, for a total weight of 14,589 tons and total length of 4,652 feet. Figure 1 shows the length and tonnage profile of the train. “This was a fairly typical unit train consist with good, even loading,” Fowler said.
The investigation of this derailment explored many potential contributing factors, considering both vehicle and track conditions as well as the interaction between them. The factors included:
- Track maintenance practices and history, including tie and fastener conditions
- Track geometry, particularly grade and curve superelevation
- Train handling, such as braking, acceleration and speed
- Rail profile and wheel/rail contact characteristics including L/V forces
Modeling and simulation were also performed to determine in-train forces, such as buff and draft, and the vehicle dynamics of the cars involved in the derailment.
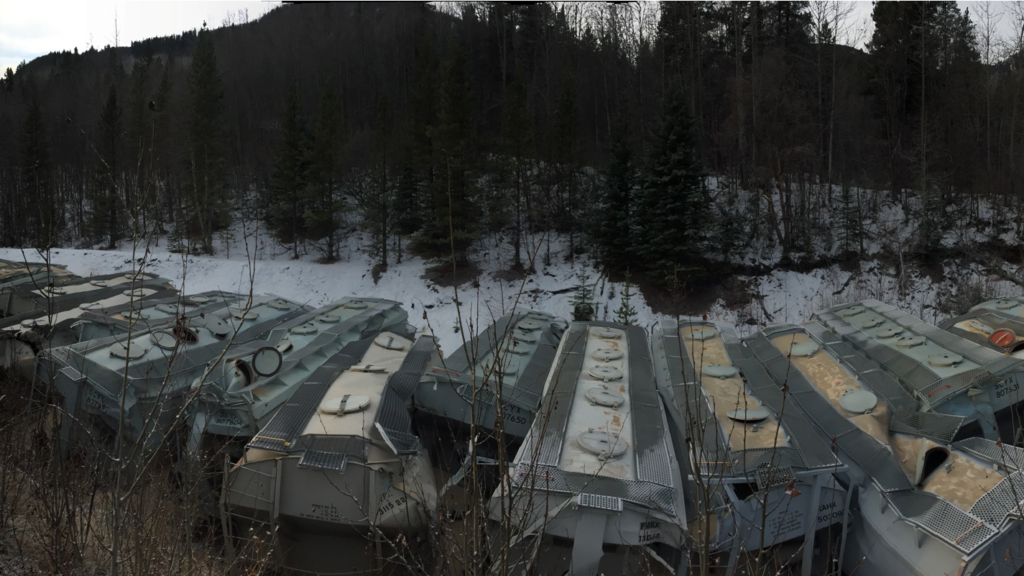
Inspection of the site immediately after the derailment revealed that the three head-end locomotives and the first following car (#1) remained on the track, however the lead wheelsets of the trailing axles on the 2nd and 3rd locomotives derailed (see the highlighted trucks in figure 5). Cars #2 through #29 derailed. Cars #4 through #26 were in jack-knife position perpendicular to the track (see Figure 2). Cars #27, 28 and 29 were derailed upright on the grade. “The way the cars are laid out often holds clues about the root cause of the derailment,” Fowler said.
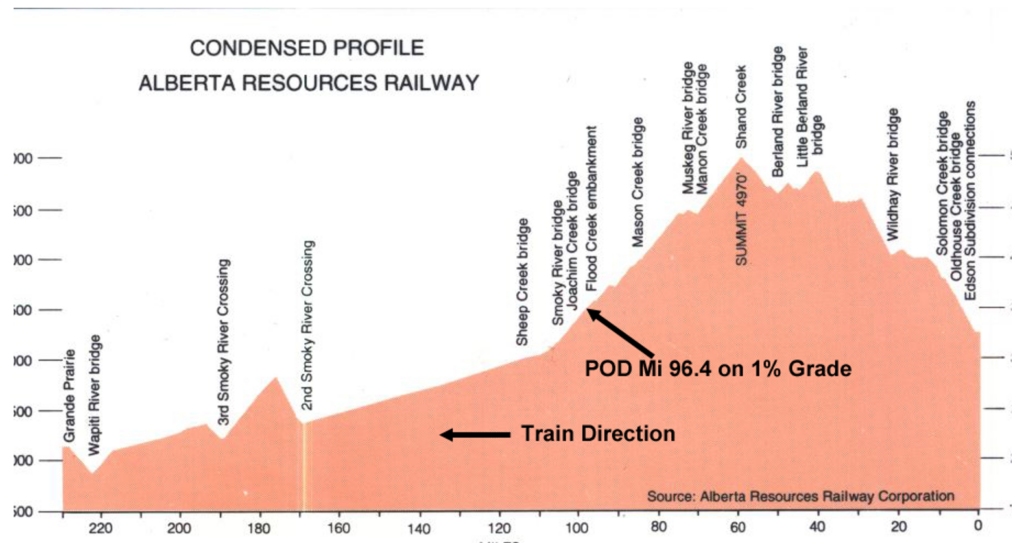
Figure 3 shows the elevation profile of the region, with the point of derailment indicated by an arrow at milepost 96.4; the train was descending on a 1% grade, in a 6-degree right-hand curve. At the time of derailment, the train was travelling at 27mph with dynamic braking (DB) in position 5 (DB5), with no automatic air brakes applied. In addition to this, investigators later noted the following preceding conditions:
- All five locomotives were in serviceable condition with no outstanding maintenance issues.
- Ultrasonic testing of the site conducted roughly two-weeks prior to the derailment did not identify any defects.
- No alarms were triggered at preceding hotbox detectors.
- The hopper car wheels were in good condition, not exceeding any threshold for hollow wear or flange wear.
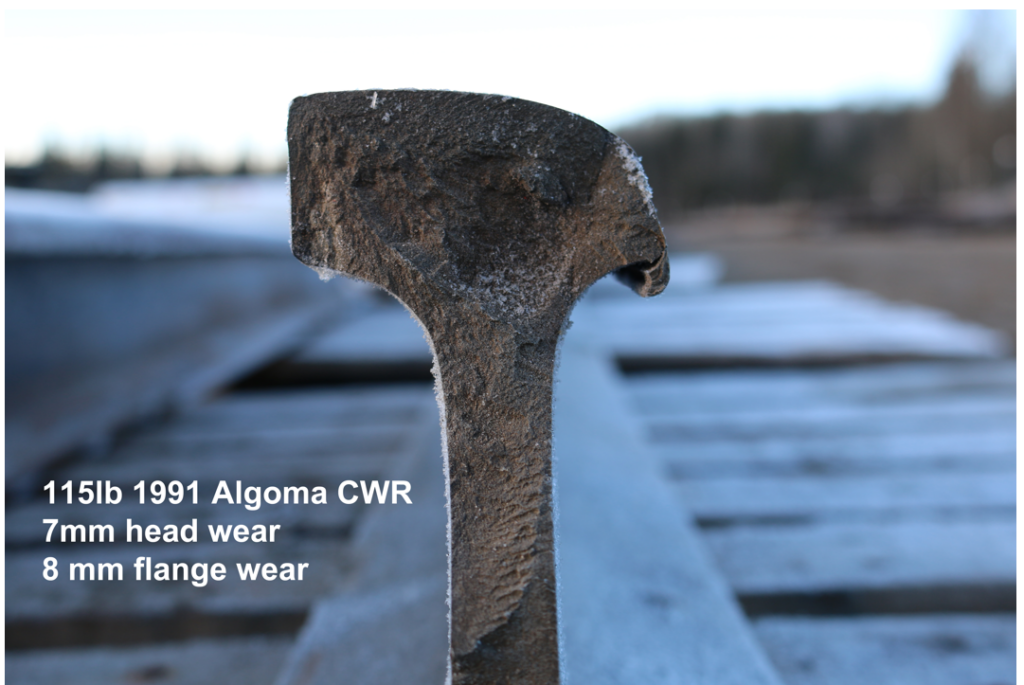
The track itself was Class 2 track with a posted maximum speed of 25 mph. In 2016, the year of the derailment, it saw 11.6 million gross tons (MGT) of traffic. 14in double-shoulder plates with 4 spikes per plate fastened the track to a mix of hardwood and softwood ties and the ballast was fully anchored and in good condition. The derailment site was bracketed by wheel-flange lubricators located at MP 96.2 and 100.1. Notably, the high rail had 7mm of head wear and 8mm of flange wear, which was only 1mm of head wear less than the CN limit requiring the installation of high-clearance joint bars, Fowler said (see Figure 4).
Shortly before the derailment, the point-of-derailment (POD) curve was subject to significant remedial maintenance. Roughly 4 months prior to the derailment, new ties were installed in the POD curve to address wide-gage conditions detected by a regular geometry test. Three months prior to the derailment, a 34-foot plug rail was installed at the high rail. Records show that both joints were fully bolted at the time of installation. Two months prior to the derailment, the low rail in the POD curve was fully replaced. The installation of the new low rail effectively reduced the average superelevation of the curve by 0.42 in, to 0.99 in. This is significant in that the design speed of the curve was 26.7 mph at a balance superelevation of 2¾ inches. This means that a vehicle moving at 27 mph through the curve (as in the case of the derailed train) is operating at nearly 2 inches of cant deficiency or underbalance. “Securement of the low rail was also strengthened at the time [of rail replacement], due to increased spiking, and gluing of the spike holes,” Fowler said.
In terms of vehicle dynamics, it’s important to understand that individual cars don’t exist in a vacuum, interacting only with the track. This is particularly true of unit trains, he said. Cars with the same design and loading in a unit train consist tend to respond as a single unit. Each car acts on the track in generally the same way as the one before, concentrating their cumulative impacts and allowing little time for elastic recovery in the rail, fasteners, and the track as a whole between cars. In addition, the 42-foot frac sand hoppers that made up train A45851 have characteristics that cause them to interact with the track differently from more common 59-foot covered hoppers, Fowler said. The frac sand hoppers have an outside length of 42-foot and truck center distance of 28 ft 8 inches, compared to a more typical hopper with an outside length of 59 ft and a truck center distance of 46 ft. This means that the 42 ft hopper has a shorter wheelbase to length ratio (1.48:1) than the 59 ft hopper (1.28:1). Loaded frac sand hoppers are also 20,000 – 30,000 pounds heavier than a contemporary 59-foot hopper. These differences naturally result in differences in dynamic performance — something that can help to explain why a specific train derails at a specific location, while others don’t.
Post-derailment modeling and analysis of train A45851, which included car type, lading, speed, and grade, indicated that DB application (in position 5) generated in-train buff forces of 100 kips. This energy was transmitted through the drawbars, trucks, and wheel/rail interface to deliver transformed lateral forces of 17.8 kips for the hopper cars and 23 kips for the locomotives, Fowler said. The relatively shorter distance between truck sets in frac sand hoppers causes more overlap between lateral loads imparted to the track by each truck, particularly in a buff force scenario, and particularly in a curve in which the drawbar angle has reached its maximum limit and couplers are pushing against the side of the housing.
Based on data collected at the POD, vehicle and train specifications, track geometry, and wheel/rail profile data, CN used multiple types of simulations to determine what combination of conditions triggered the Grey derailment. Broadly, these simulations included Quasi-static Lateral Train Stability (QLTS), Train Operations Simulator (TOS), and Train Energy and Dynamics Simulations (TEDS) models. QLTS results indicated that lateral forces for locomotive/locomotive, locomotive/car, and car/car combinations were all less than 13,000 lbs, resulting in a truckside L/V of 0.19. To put this in perspective, the L/V threshold for rail rollover potential on well-maintained track is 0.65. The potential for wheel-climb occurs when the L/V ratio exceed 0.80. The QLTS simulation indicates a low risk of rail rollover, however, the model does not account for wheel and rail profiles, and it assumes the track is in nominal condition with no local irregularities.
TOS simulations indicated that in-train drawbar forces on the locomotives were below 100 kips when the locomotive derailed; these values were considered non-causative for well-maintained track. TEDS data indicated in-train buff forces between 85 and 115 kips based on two locomotives operating at DB5. This translated to L/V ratios of ~0.51 for the hoppers and ~0.48 for the locomotives — closer to, but still technically below the rollover threshold. Resultant lateral forces at the lead-axle high-rail wheel were simulated to be 22 kips for the hoppers and 26 kips for the locomotives.
Dynamic Wide Gage
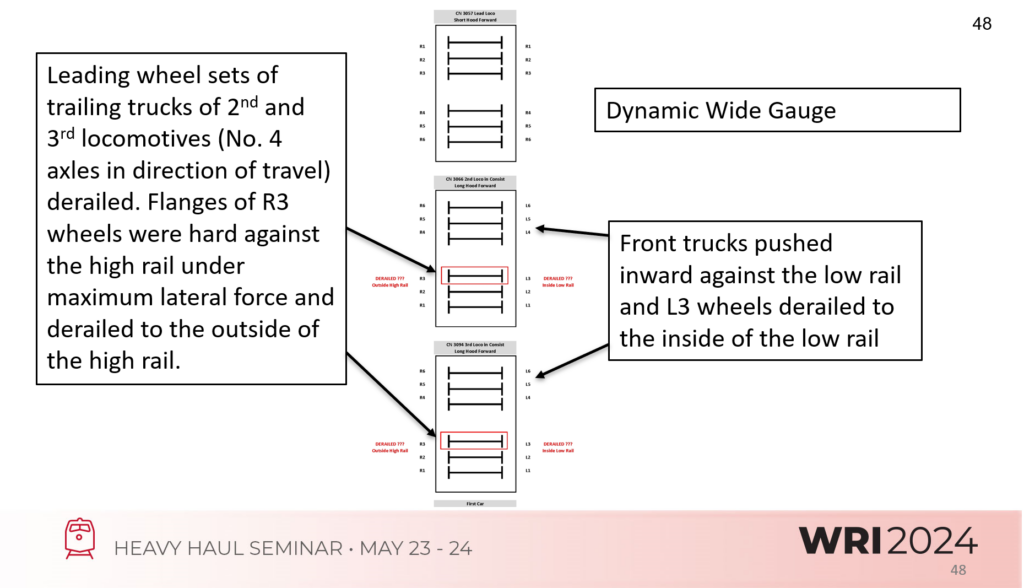
Due to significant gauge face wear on the high rail, the wheel/rail contact patch was shifted further to field than is optimal, effectively lowering the L/V rollover threshold. The high lateral resilience of the low rail due to the recent tie and fastener renewal further concentrated gage-widening forces on the high rail. With the train already running underbalance, the additional lateral force from in-train buff forces concentrated further on the high rail. This unlikely, but not impossible, confluence of factors caused the high rail to roll outward (to field) under the second lead locomotive, thus initiating the Gray derailment. Figure 5 illustrates the three head-end locomotives (the high rail is on the left). The investigation found that the fourth axle of locomotives two and three were the first to derail under dynamic wide gage — the ultimate cause of the derailment. “In dynamic wide gage in curves, it’s quite important that both rails have similar fastener resistance. Elastic fasteners would have been an even better choice, in a curve like this,” Fowler said.
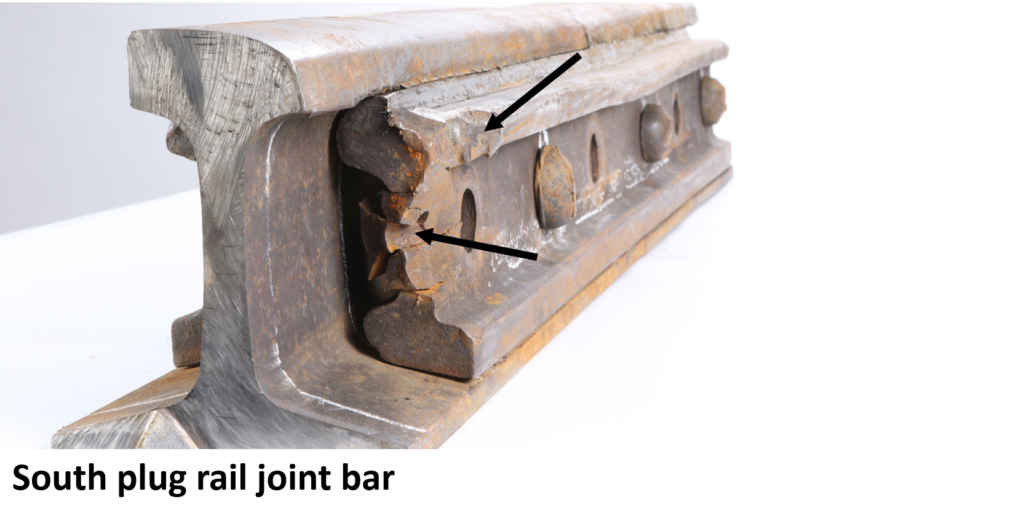
Figure 6 shows part of the plug rail and joint bar cut from the high rail. Wheel and flange marks are visible on the joint bar indicating impacts after the rail rolled over. Three of the bolts were shorn off as a result.
As a result of this derailment, CN undertook a number of safety measures, including:
- Deploying a gage restraint measurement program
- Reviewing superelevation standards and practices
- Implementing mandatory use of air brakes in combination with DB
- Increasing track inspection frequency
“Any of these efforts alone might have been enough to prevent this derailment,” Fowler said. Unfortunately, derailments are often the result of a confluence of events and conditions that can be difficult to detect even for the seasoned expert. In-depth investigations of derailments like these can help to identify and mitigate potential risks before a train ends up in the ditch.

Jeff Tuzik is Managing Editor of Interface Journal
This article is based on a presentation made at the Wheel Rail Interaction 2024 Heavy Haul conference.

