
Leveraging the Potential of Autonomous Inspection Data on Canadian National
By Jeff Tuzik
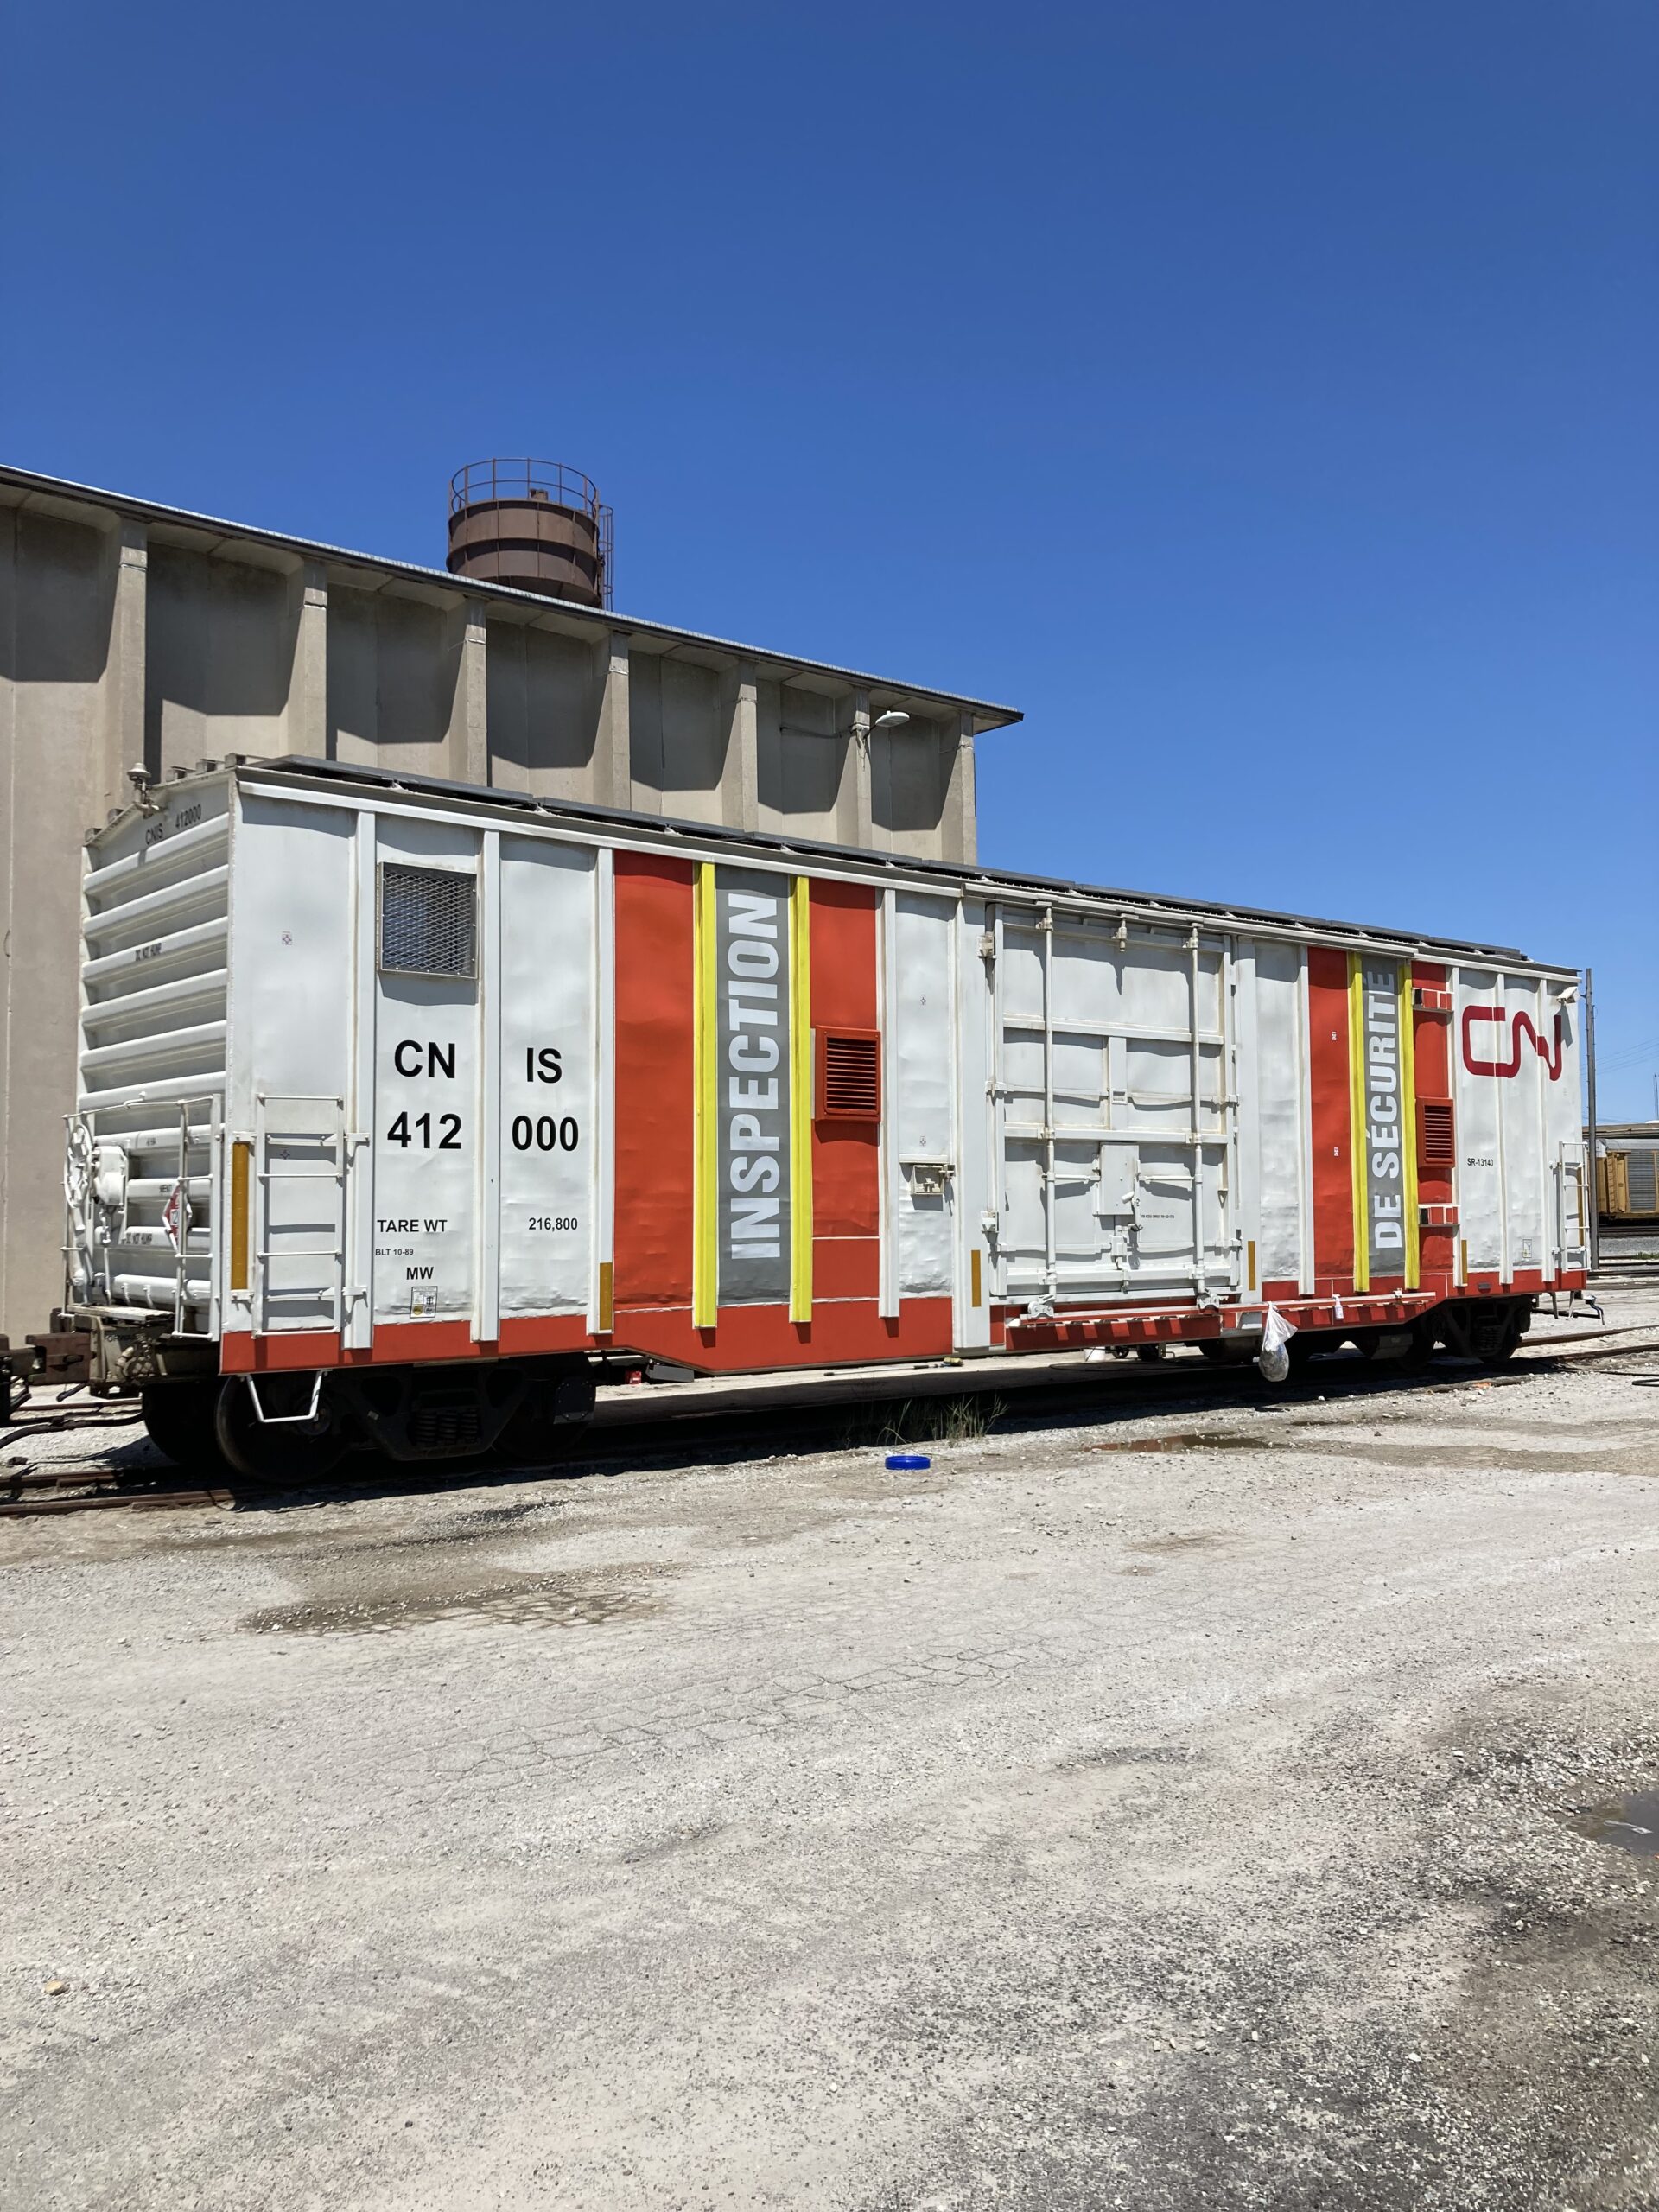
Autonomous track inspection technologies play a large and growing role in the maintenance and monitoring strategies of freight railroads in North America. While the technologies are relatively new, they have already evolved, along with the goals and overall capabilities of track inspection. On Canadian National, Automated Track Inspection Program (ATIP) data is being used to guide and optimize track maintenance, capital expenditure, operational improvements, and the allocation of manned track inspection assets. And that’s just the beginning.
Before the advent and widespread adoption of autonomous inspection technologies, Class 1 railroads like CN depended primarily on manned geometry systems to collect track geometry (and other track condition) data. Those systems typically required a locomotive to pull them, along with a train crew, an engineer/conductor, geometry vehicle operators, and specialists to review the data in real time to confirm accuracy. They also required frontline engineering personnel onboard to direct remedial actions to address any identified defects or exceptions. “We’re talking about a pretty significant manpower requirement on top of the fact that you’re butting up against revenue service as you move up and down the network,” Dan Leeb, Senior Manager of Advanced Technologies at Canadian National, told colleagues at the 2026 Wheel/Rail Interaction Heavy Haul Conference.

CN’s ATIP/ATGMS (Automated Track Geometry Measurement System) program began in 2019, with the instrumentation of eight boxcars that traverse the network as part of normal revenue service. The cars, which are weighted to ≈230,000 lbs to facilitate the collection of loaded (dynamic) track geometry, were initially outfitted with a typical suite of geometry-measurement hardware (primarily multi-axis accelerometers), Leeb said.
One of the most immediate effects of moving to ATIP has been to relieve the logistical and personnel pressures, and to eliminate much of the “friction” between inspection and maintenance requirements and revenue service constraints, Leeb said. “If we know we want to inspect a specific part of the network, it’s now as simple as moving an ATGMS car into a consist that is passing through. The overhead is effectively gone.” Data collected from autonomous vehicles is then transmitted to a central location where it is processed and analyzed—a procedure that streamlines both operations and data-handling.
“CN’s network design is such that we have a lot of pretty straight-forward long-haul routes, so we’re able to cover a lot of our network [using ATIP] at a very high frequency and data velocity, relative to the rest of the industry,” Leeb said. The efficacy (and efficiency) of CN’s ATGMS program is particularly evident in the number of inspected track miles prior to and after the introduction of the first 8 (now 10) automated inspection vehicles.
Prior to the introduction of ATIP, CN collected geometry data on ≈50,000 to 80,000 miles of track per year. With the ATIP program up and running, they have collected data on ≈800,000 to 950,000 miles per year. Leeb attributes this partially to the Transportation department: “They’ve done a great job of prioritizing the movement, and quick turnaround of [the ATGMS] cars in our terminals.” CN typically runs the ATGMS cars on the head-end of locomotives to facilitate those logistics.
Since the 2019, CN has also continued to expand the measurement capabilities of their autonomous inspection fleet. In addition to track geometry systems, the cars are now equipped variously with laser-based rail profile scanners, a multi-purpose vision-system for evaluating joint bars, tie, and ballast conditions, and as of 2025, ground penetrating radar to measure ballast/subsurface conditions, Leeb said. “This is probably one of the most comprehensive ATIP technology stacks in the industry.”
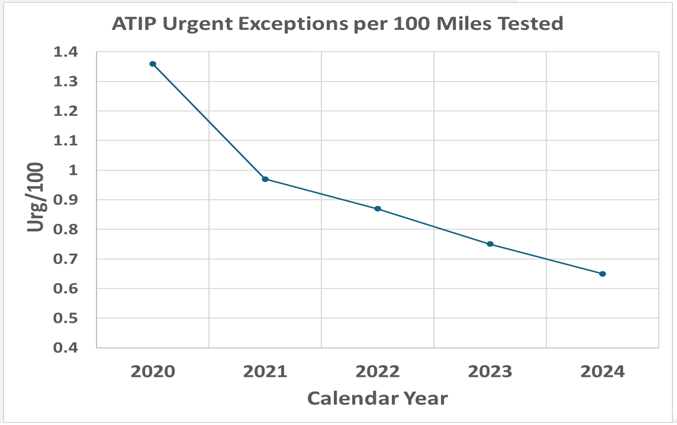
Of course, data is only as valuable as how it’s utilized. CN leverages the breadth of data it collects in several key ways. “One of the biggest immediate benefits we had with ATIP was the increased frequency of testing, which in turn led to a profound reduction in defect latency,” Leeb said. For example, a manned geometry inspection program may measure a section of track four times a year, with each inspection spaced roughly three months apart. But track geometry, particularly when in sub-optimal condition, can degrade very quickly between tests, based on many factors including time of year, tonnage, the type of defect, and others. But CN’s autonomous fleet re-tests most sections of track on a near-weekly basis, at least. So incipient defects that might easily slip past less-frequent manned geometry tests can easily be measured, trended, and mitigated before they reach a more urgent stage. Figure 2, for example, shows the downward trend for urgent exceptions per 100 miles tested post-ATIP implementation.
Monitoring the condition and growth of defects also allows CN to better prioritize maintenance and to monitor track conditions after remediation and repairs to ensure that the root cause of the matter has been addressed, Leeb said.
“ATIP doesn’t just find defects, it drives data-informed decision-making across the network. I think any Class 1 railroad would tell you the same thing.” – Dan Leeb
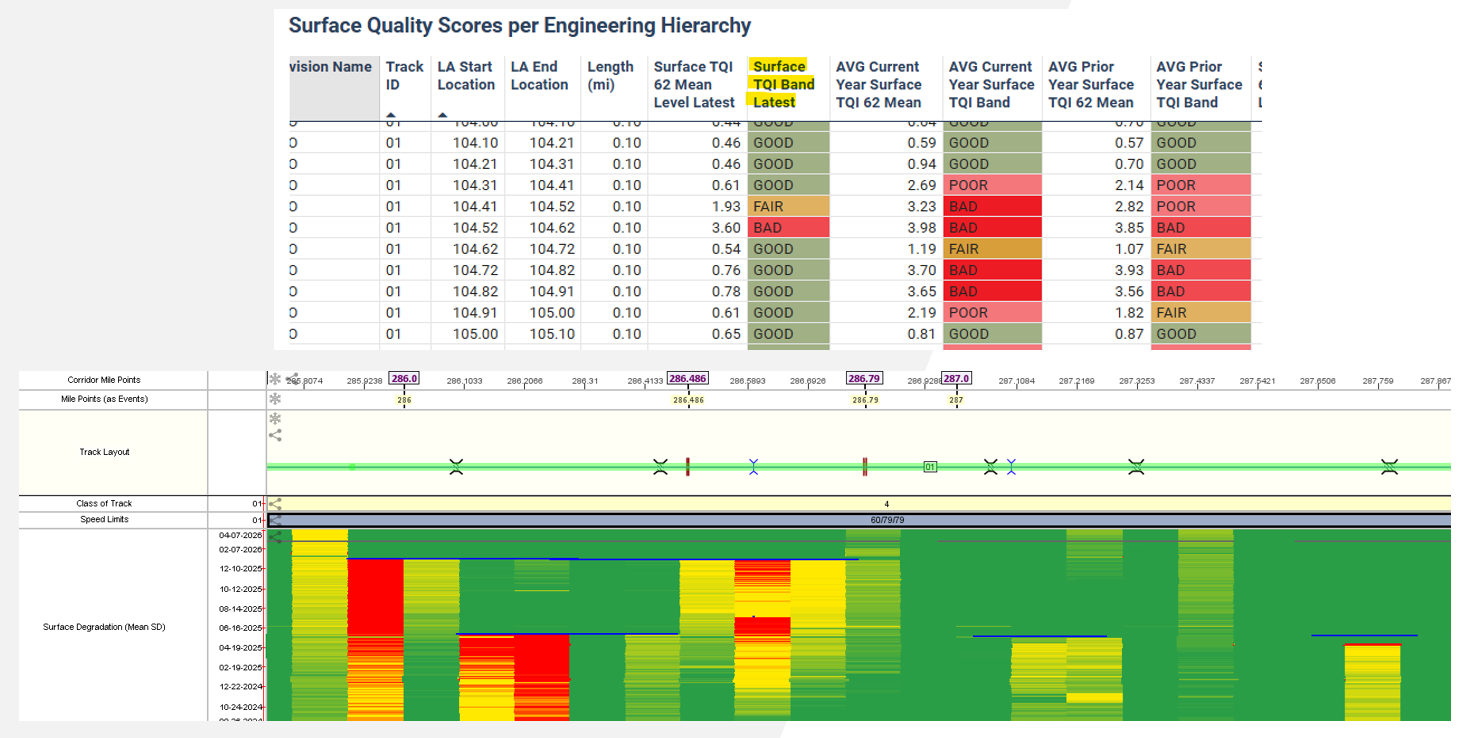
As CN has collected more ATIP data in aggregate, they’ve also developed more sophisticated methods of visualizing, utilizing, and leveraging data at both micro- and macro-scales, Leeb said. The graphs in Figure 3, for example, show different ways of visualizing track quality index (TQI)—an industry standard measurement value that indicates the overall “smoothness” of the track—in 0.10-mile segments. In the lower graph, TQI can be seen to worsen over time (i.e. moving from green to red) in specific sections, indicating a potential defect or some type of root-cause issue. “We use this kind of data to make sure we’re not just looking at a specific defect, but the condition and trend of the surround track, as well, to make sure that we’re making the right repair for the situation,” Leeb said.
On a larger scale, CN also uses ATIP to look at defect growth, TQI, and other metrics on a corridor and even network-wide scale. “We can aggregate all our inspection data, including geometry, rail wear, rail-surface condition, tie data, and the like to look at the big-picture trends when it comes to capital spending and allocation,” Leeb said.
Visualizing and working with so much data in aggregate is not a simple process. But it’s an area in which CN devotes a lot of ongoing research and development work, because the benefits are clear. “Bringing all this [ATIP] data together in a way that can help us solve very complex operational challenges isn’t just a CN goal, it’s an industry goal,” Leeb said.
CN recently leveraged their aggregated ATIP data to address the problem of ice jacking (or tie-plate icing) in which ice accumulates between the rail and the tie plate and induces gage widening under load.
At one location, ATIP data flagged rapidly widening gage, triggering a manual inspection and maintenance intervention. “It was a good catch, so we started looking at other data from that location to determine if we could reliably identify and flag ice-jacking locations,” Leeb said. They analyzed the data present at the confirmed ice-jacking site—a combination of rapidly widening gage over time, large changes in rail cant, differences in measurements from month to month, and deteriorated tie condition—and began working on criteria to apply that combination of factors to other sites on the network. The ice-jacking risk analysis that came out of this project can now be run on any track section in the CN network, Leeb said.
Longitudinal rail movement is another issue to which CN applied a similar methodology. “There are a lot of factors that can contribute to longitudinal rail movement, but there’s no single formula or parameter that you can point to as the critical culprit,” Leeb said. Once again, by aggregating ATIP data—information on tie condition, ballast condition at the tie shoulder and crib, box anchor pattern, and anchor offset—CN has developed a model for identifying a track-structural risk for rail longitudinal rail movement. The model also includes data from non-ATIP sources such as track grading information (length and depth of grade), tonnage information, and train braking data. “We have the information; it’s just a matter of making it all mesh together and getting it to the front-line people who are making decisions on the ground. And the analysis should make it clear what the ideal remediation effort is.”
The ATIP/ATGMS program at CN continues to be refined and improved, but it has already had a tremendous impact on track condition visibility and maintenance priorities. Part of the success of the program at CN is due to the close relationship between the ATIP teams and the frontline engineers. “It’s tempting and easy to get lost in the flow of all the different data streams available, but you need to know what problem you’re trying to solve you’re not drowning people in raw data,” Leeb said. On the technology side of things, Leeb said that a strong GIS database is the backbone of the system—enabling precision and reliability from which all other data flows. It’s also important that the ATIP architecture is modular in order to rapidly and seamlessly incorporate new technologies into the program. These tenets have driven the development and growth of CN’s automated track inspection program, and the results are hard to argue with.

Jeff Tuzik is Managing Editor of Interface Journal
This article is based on a presentation made at the 2026 Wheel/Rail Interaction Heavy Haul conference.
Images are courtesy of CN except where otherwise noted.