Reducing the Stress State on Canadian Pacific’s Western Corridor
By Mike Roney • July, 2009
Canadian Pacific has taken a unique approach to reducing the stress state in its western corridor. The approach includes the implementation of distributed power and the implementation of friction management. It also includes examination of their combined effects — something that is relatively new. Looking at CP’s operation from Vancouver to Montreal and into New York, this project is primarily focused on the Western corridor, running between Calgary and Vancouver and crossing over the Pacific mountain ranges as the traffic makes its way to the coast.
In this area, the ruling grades are 1.25% for westward traffic, and 2.4% for eastward traffic. It’s a key area with heavy grades and high tonnage. Under these types of conditions we can clearly see the impacts of power configuration and under-speed conditions. Wherever there are heavy grades, there tends to be a lot of curves. In these types of areas, it is easy to see the accelerated wear, as well as the impacts of friction and friction management, and the impacts of distributed power.
The use of distributed power has attracted significant attention over the past several years. CP’s objective in implementing distributed power in the western corridor was to take a scientific approach to appropriately powering the trains and achieving the lowest overall system cost. The key questions are: How does power configuration and train length affect fuel consumption, train velocity, train forces, and track costs? CP’s goal was to look beyond individual train performance and at optimizing the overall system.
In this project, work was done in conjunction with Applied Rail Research Technologies (ARRT Inc.) to look at the impact of the powering of trains, power positioning along the train, speeds, superelevation, angles of attack and drawbar forces, and to perform modeling with respect to balancing superelevation with train speed in both ascending and descending grade operations. ARRT’s software showed CP that track costs are minimized when uphill and downhill trains run at close to the same speed.
The software also showed that in heavy grade operations, the interaction between ascending and descending speeds must be balanced. Uphill trains tend to lean on the low rail and produce high damaging loads, high angles of attack and truck skew. Downhill trains run at higher speeds and tend to lean on the high rail. As a broad conclusion, the ideal situation (i.e. the lowest forces, track structure degradation and costs) is achieved when uphill and downhill trains operate as closely as possible to the same speeds. The wrinkle is that an adjustment must be made to superelevation to compensate for the effects of drawbar and other vehicle / track forces.
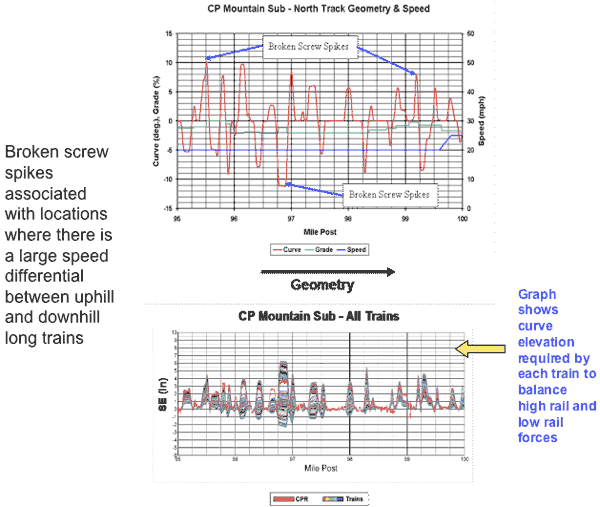
The geometry car readout shown in Figure 1 plots loaded gauge, which is overlaid with an analysis of superelevation bandwidth — the full range of superelevations needed to achieve balanced forces for all of the trains over a particular segment of track. In the geometry car trace, several spikes and ripples appear, corresponding to locations of broken screw spikes (CP uses cut spikes in tangent sections of this timber tie track, and rolled plates with premium fasteners in sharp curves). Spikes that appear in sharp curves tend to correspond to areas that require superelevation adjustment due to the different speeds at which trains are operating, or adjustment to the powering or braking of the trains.
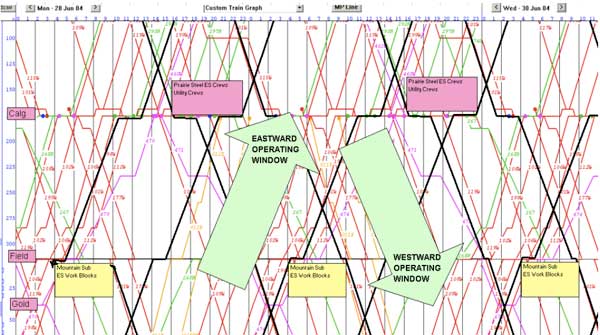
Looking at corridor fluidity, each of the traces shown in Figure 2 shows the progress of a train with time. This is predominantly a single-track operation, with segments of double track. Balancing the flow through this corridor comes down to balancing between the eastward and the westward operations. The use of distributed power and corresponding increase in velocity tends to improve the overall capacity in the corridor.
As a result of the investigation into the effects of distributed power, CP is running some new models (train makeups and distributed power configurations). These are primarily built around a 2-1-1 configuration (2 head-end locomotives, 1 mid-train and 1 pusher). Based on these models, CP has begun running 129-car coal trains, 142-car potash trains and has tested 168-car grain trains (with 5-locomotives).
Friction Management
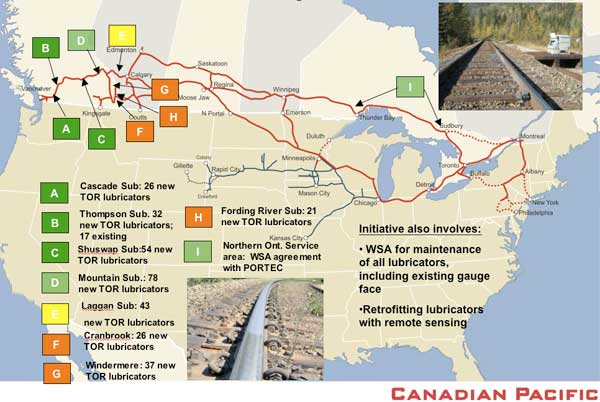
CP’s western corridor is the main focus of CP’s Total Friction ManagementTM (TFM) initiative, a combined project between Canadian Pacific and Portec Rail. Looking at Figure 3, dark green areas correspond to territories where deployment is complete (i.e. top-of-rail (TOR) friction management has been rolled out in conjunction with gauge-face lubrication). Light green indicates areas where deployment is partially complete; yellow is new in 2009; orange is scheduled for 2010.
The CP Western Canada TFM initiative covers the mainline route west of Calgary — a total route mileage of about 900 miles. Implementation includes the addition of about 308 TOR application systems to the 17 that were already in place from an earlier pilot program. A curvature threshold of 4 to 5 degrees — the point at which steering saturates — was put in place for TOR coverage. The program focuses on territories where curves are particularly sharp, where rail wear and track degradation is particularly high.
The objective of TOR friction control is to take friction from a dry level, which can be as high as 0.7 and move it down to the target level of 0.3 to 0.4. The Portec Rail PROTECTOR IVTM applicator can be either solar or AC powered (there is a mix of the two throughout the territory), and applies a water-based TOR friction modifier (KELTRACK®).
The supplier, Portec Rail, provides the lubricators and friction modifier systems, as well as the friction management consumable. In addition, the project includes an ongoing management package, which includes remote performance monitoring, as well as maintenance and filling.
There are several unique aspects to the TFM project at Canadian Pacific. One of them is the interaction between the supplier and the railroad. In this case, there is an overall service provision in which Portec Rail provides regular inspection of the gauge-face and TOR systems, as well as daily direction to CP maintenance personnel. (CP unionized lubrication maintainers and filling resources take daily direction from Portec Rail.) Portec Rail also provides remote performance monitoring — data review and training — and reports on the overall performance of the system over time. The coefficient of friction and lateral/vertical forces are measured to verify that things are working as they should.
Looking at the economic side of the equation, CP subcontracted the development of a comprehensive business case to the National Research Council of Canada, which included reductions in rail and wheel wear, fuel savings, and reduced maintenance and infrastructure costs.
The net result of the model is a projected savings on the order of $3.2 million across the system annually in rail wear, $0.4 million in wheel wear, $1 million in re-gauging costs, and $5.2 million in fuel savings. One of the most unique aspects of the project is that CP took these results, which were thought to be conservative, and made adjustments to operating budgets including transfers from both the transportation (fuel) and mechanical (wheel) budgets into the engineering budget to support the operating costs of the TFM initiative.
Results
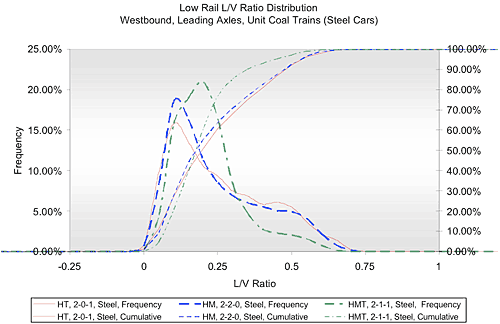
A lateral and vertical force measurement system was deployed on a 6.5-degree curve just west of Revelstoke in the Shuswap subdivision. This location has loaded westbound unit trains traveling under-speed at close to peak adhesion on a sustained ascending 1% grade. Figure 4 shows the distribution of low rail l/v ratios. The traces indicate the different distributed power configurations investigated for unit coal trains (CP is running both steel and aluminum coal cars). A shift can be seen in the lateral loads when comparing the distributed power configurations to the standard 2-0-1 model. A moderate shift can be observed in moving to the 2-2-0 model, and a substantial shift moving to the 2-1-1 model (the optimum model for operation in the corridor).
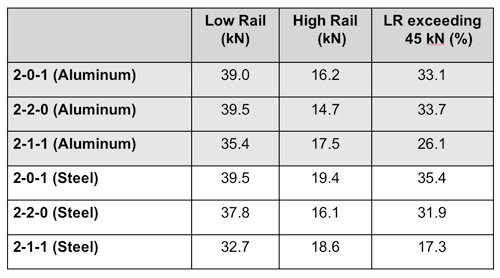
Table 1 compares average values of peak low rail lateral forces (in kilo-newtons) between the distributed power models that were implemented for aluminum and steel car sets. It can be seen that the low rail lateral loads are initially substantially higher than the high-rail lateral loads in the under-speed conditions. It can also be seen that the forces are reduced when moving from the 2-0-1 to the 2-2-0 and the 2-1-1 configuration. Average values have gone from a 39 kilo-Newton average, leading axle, peak lateral load, down to a 35.4 kilo- Newton average for the aluminum car sets, and from a 39.5 to a 32.7 kilo- Newton average for the steel car sets.
In some cases, increases can be seen in high rail lateral loads in moving to the optimal distributed power model. This is a result of moving toward a more balanced operating condition.
Train Speeds
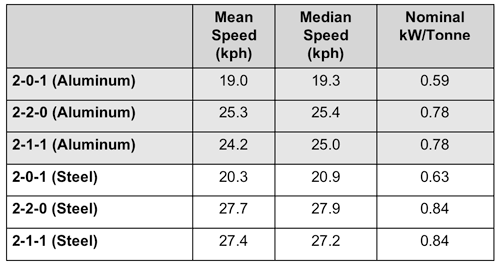
Table 2 lists the nominal increases in specific power (kilowatts per ton) when moving from 2-0-1 to 2-2-0 and 2-1-1 power models. The influence on speed, going from the 3-locomotive model up to the 4-locomotive models is also shown. The 2-2-0 and 2-1-1 produce similar speeds running through this test area, but there is a distinct difference in the lateral force performance. This indicates that the distributed power configuration isn’t only about raising train speed, it’s also about the interaction between the various in-train forces.
Friction Management
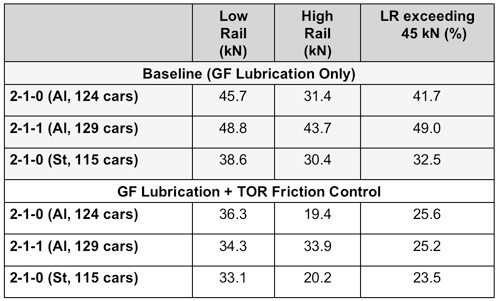
Table 3 shows lateral force data corresponding to the transition from gauge-face (GF) lubrication (only) to GF + TOR friction control with the implementation of Total Friction Management, and illustrates the effects of friction management on a series of distributed power models.
As can be seen in the table, with a 2-1-0 power configuration, lateral forces on the low rail were reduced from 45.7 to 36.3 kN on aluminum (124) cars, from 48.8 to 34.3 kN on aluminum (129) cars and from 38.6 to 33.1 kN on steel (115) cars.
The percent of forces exceeding 45 kN was also reduced substantially. The net result is that implementation of an effective TOR friction control program provided further reductions in damaging lateral loads, over and above the improvements achieved through distributed power.
Results in Western Canada
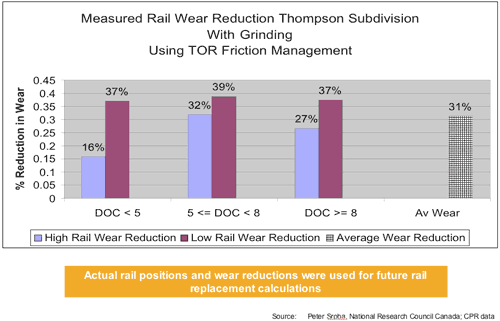
Looking at rail wear results, the data shown in Figure 5 is taken from a comprehensive “100%-effective friction management” program executed in collaboration between CP, the NRC-CSTT, Portec Rail and Kelsan Technologies in 2004 / 2005. This Figure illustrates the reductions in rail wear (a higher number is better). The figure also shows reductions in high rail and low rail wear with the implementation of TOR friction control in addition to gauge-face lubrication. It is divided into curvature categories: mild curves (less than 5 degrees), moderate curves (between 5 and 8 degrees) and sharp curves (greater than 8 degrees). Reductions in total aggregate wear, including both natural wear under traffic and grinding are seen on the order of 16% – 37% in mild curves, 32% – 39% in moderate curves, and 27% – 37% in sharp curves. This represents an overall average of 31% reduction in aggregate wear.
Fuel Savings
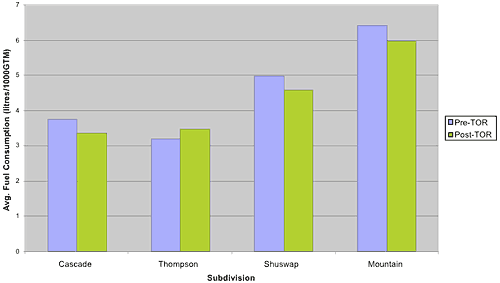
Q-tron fuel-consumption data was collected on the Cascade, Thompson and Shuswap subdivisions between September and March and normalized to yield liters-per-thousand gross ton miles. The blue bars shown in Figure 6 are pre-TOR normalized fuel consumption; the green bars are post-TOR consumption.
The Cascade, Shuswap and Mountain subdivisions show reductions in fuel consumption on the order of an 8%, going from a pre-TOR to a post-TOR condition. The Thompson subdivision seems to represent an anomaly. There are two reasons for this. 1) The Thompson subdivision was the location of the pilot project that the business case was built on. That subdivision already had 14 TOR lubricators in place as the pilot, so it should have shown a lower benefit. 2) In the course of this first year, however, a dedicated lubrication maintainer bid off the job and it took several months to replace him. As a result, there were several months during the year with reduced lubricator maintenance, application and effective coverage. In effect, this provides proof in the opposite sense: The subdivision that already had friction control in place went through a period in which the friction control was not maintained, and the associated penalty can be seen.
Conclusions
The optimal placement of distributed power has significant impacts and can result in higher train velocities, reductions in forces and track structure savings. Total friction management also has the effect of reducing the stress state, with the corresponding business case (which included the cost of deployment of hardware and consumables, and the addition of seven new dedicated positions), projecting less than a two-year payback on the project.
The combination of the two technologies clearly shows that there are synergies to be realized from the interplay between optimized distributed power, optimized superelevation and the implementation of effective friction control.

