Friction Management and Curve Elevation
By Mike Gilliam and Russell Rohlf • October 2010
Optimizing friction management is an ongoing project on Union Pacific. Gauge-face (GF) lubrication is a long-standing program, but it requires an additional 400 units to reach optimum efficiency. A large number of top-of-rail (TOR) units are needed, as well, as UP is only beginning to deploy this technology. UP must also determine if all of the existing units are in the ideal locations and have the same capacity as the state-of-the-art technology. That aside, the cost to optimize both TOR and GF lubrication programs would be more than $70 million in base capital upgrade costs and approximately $24 million in maintenance costs, which include product purchase, head counts, and vehicle and parts maintenance costs. These figures beg the question: How does UP justify such spending and ensure that the benefits of these programs outweigh the costs?
Tests and studies, such as the UP’s Tehachapi Study and Canada Pacific’s Total Friction Management (1), have confirmed the benefits of GF and TOR friction management. The rail life extensions identified by these studies are the foundation on which UP has built a financial case for the widespread implementation of friction management.
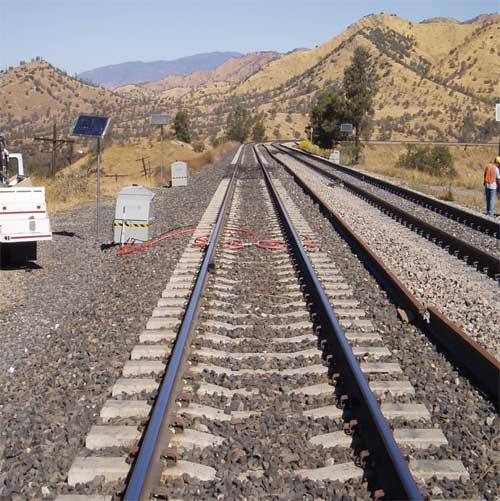
Results of rail savings demonstrated in the Tehachapi tests are shown in Figure 2. In this test, the control zone had only GF lubrication; the test zone had both GF and TOR lubrication. The study, which shows significant rail savings in the test zone versus the control zone, is proof of the value of TOR lubrication as a complement to the GF program. This data, which shows curves that did not have to be re-laid, was instrumental in allowing UP to increase funding to expand TOR implementation. Even so, the total cost of implementation is a large pill to swallow. And due to various other track maintenance needs, friction management programs cannot be completed all at once, despite the attractive return on investment.
Based on the results of these tests, UP is able to accurately model the benefits of friction management on each of the 5,900-plus friction management units requiring optimization. This illustrates the benefit of each unit, allowing for prioritized upgrades, and ensuring optimal return on each capital investment.
Maintenance Strategies
Since upgrading friction management units in order to keep up with the state-of-the-art is prohibitively expensive, UP is examining ways to increase the reliability of the existing equipment. This takes several forms. One is simply keeping the tanks on the lubrication units full. Another is monitoring older units and performing the maintenance necessary to keep them running. These tasks must be performed by people who are often called away to tend to other duties. By increasing the accountability of maintenance personnel, UP has taken steps to ensure that these critical tasks are completed. Those responsible for the maintenance of TOR and GF units turn in daily inspection and work logs showing what was done and where. This is coupled with a work plan that ensures that each unit is inspected within a specified period.
In order to keep friction management units full, UP is also looking into bulk filling in areas with a high population of units. This would relieve maintenance personnel of having to fill the tanks, giving them more time to concentrate on maintenance, itself. Free from having to manually top off tanks, maintainers can cover larger territories. This has the potential to reduce the total maintenance staff required. The cost/benefit analysis of this process must be modeled; adjustments may be necessary before bulk filling is implemented.
Remote monitoring is another strategy by which UP is working to optimize friction management equipment and related maintenance. Given the size of the UP network, the number of units in place, and the number of units required for optimal operation, it is difficult to set up an inspection or filling schedule without a precise understanding of the consumption rate of each of the units. A remote monitoring system in place at a major UP test site indicates the rate at which each unit is consuming product. With this data, maintenance crews can calculate the most efficient filling cycle. In addition to consumption rates, the remote monitoring system identifies malfunctions of the units, making it easier to schedule maintenance.
Costs/Benefits
Another initiative is to centralize the purchase of GF lubricant. Since most major suppliers do not make grease, railroads have to find a supplier. As a result, UP currently sources grease from multiple suppliers, at various prices. There may an opportunity for UP to leverage its buying power to achieve a better price across the system and save a substantial amount of money that could be put toward more units. UP is also designing a cost/benefit model that will indicate when it is feasible to replace older less efficient friction management units with newer units.
Before it can implement an optimization strategy, UP must be able to accurately evaluate new technologies and systems in order to verify the benefits. To meet that requirement, UP recently installed a lateral load station in the Blue Mountains of Oregon. This site allows UP to achieve a baseline for dry rail, measure lateral loads, and monitor rail wear and the coefficient of friction. These data make it possible to evaluate the effectiveness of various lubricants and applicator bar designs, and to evaluate the carry rates of different products and bar designs.
In addition to evaluating new technology, UP routinely evaluates existing products and technologies, as well. This helps measure maintenance quality, and illustrates the maintenance effort required to maximize the benefits of a given technology.
Proof of rail savings is another method that allows UP to quantify the benefits of friction management. UP is currently outfitting several locations with optimized GF and TOR applicators, and will monitor its curve rail program in order to quantify actual rail savings. Tangible savings of 10 miles of rail, for example, can be easier to understand and visualize than savings reported in reduced rail wear percentages. People can see and understand the impact of miles of rail more readily than the reduction from 1/32-inch to 1/64-inch of wear per year.
The final piece of the friction management puzzle is cross-functional financial participation. Many departments realize benefits from the friction management program. There are proven benefits to wheel life and fuel consumption, for example. If the departments that reap the benefits share the costs, it frees up money to expand proven programs and net more benefits all around.
Optimizing Curve Elevation
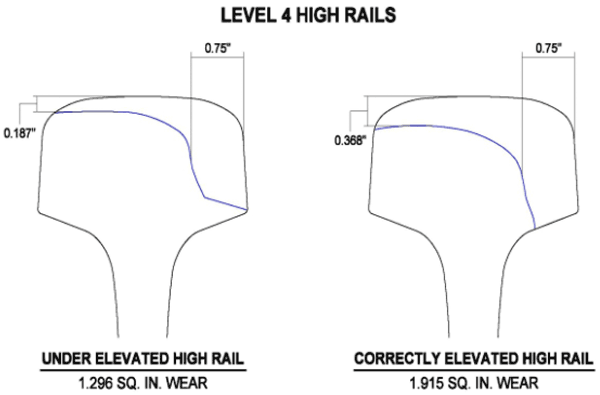
UP is also making efforts to extend curve rail life through optimized curve elevation. Proper curve elevation can greatly improve the life of curve rail, and has the potential to synchronize replacement cycles by evenly distributing wear to the high and low rails. Figure 3 shows two high rail cross sections. The image on the left shows the result of poor elevation; the curve is under elevated for the traffic running on it. This results in much more gauge-face wear, and minimal vertical wear. The image on the right shows a curve that is properly elevated and wearing nearly equally on both planes. Each of these curves has met the wear criteria to be replaced, but the curve (on the right) with proper elevation has 47% more metal removed with no more risk, since the wear is on the rail head, rather than at the gauge face. Curve elevation has the same effect on the low rail, as well. If a curve is over elevated the low rail will wear much faster than it would if it was properly elevated. The potential for rolling contact fatigue is also much greater.
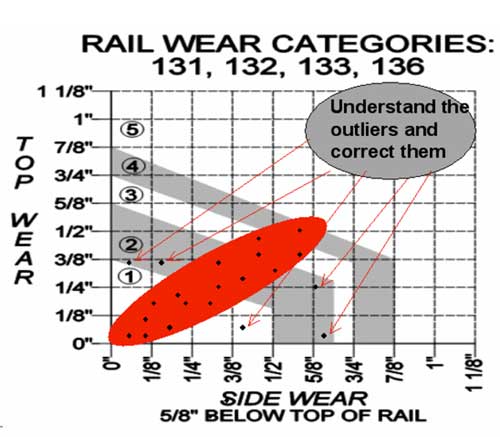
UP is using geometry car data to identify and correct curve elevations. The geometry car currently takes rail profiles every 10 feet, but will soon be upgraded to collect profiles every 2 feet. The average of the worst 40 measurements is used as the wear baseline for a given curve. With this, we will be able to monitor high rail wear patterns and determine if wear is occurring at the proper rate. Curves that show abnormal wear patterns, as shown in Figure 4, are flagged and investigated to determine the reason for that wear.
If the curve is not wearing properly and it is not set to the standard elevation it will be flagged for surfacing, to be brought into compliance. The other potential problem is not as simple to fix or identify. If the curve shows abnormal wear but is already at the standard elevation, there may be location-specific operating conditions that require a different elevation. An example of this may be a curve going into a terminal or staging location on which trains are never making speed. Reducing elevation would correct the problem, in this case. Another example may be a situation where loads running up hill are not making speed, while unloaded cars are easily making speed down hill. In each of these cases, the location must be evaluated to determine the proper elevation for that curve.
As UP moves forward with this project, it will flag curves that are outside the expected wear line by 25% or more. UP will schedule surfacing if the elevation is not set to the UP standard, or will further study it if it is. These curves will be monitored to understand the life extension benefit and to calculate the ROI.
UP is committed to fully understanding the costs/benefits of existing programs and technologies that can be used to either prove or disprove current spending levels. It may become evident that a significant increase in one area (such as rail grinding) could reduce costs in another (such as curve replacement). For every mile of curve rail that we save, we can add 1.25 miles of new rail. If we can maximize the life of rail assets, we can invest in other aspects of maintenance and make the railroad a safer place.
References
1) Roney, M., Reducing the Stress State on CP’s Western Corridor Operations, Wheel/Rail Interaction 2009, Chicago, IL.


