Assessing the Effects of Coupler Force and Train Speed on Freight Car Curving Resistance
By Matthew Dick, Gary Wolf and Jack Chislett • October, 2008
Reducing fuel costs and consumption are at the top of every railroad’s agenda. The drive to reduce fuel-related costs has launched an array of proposed techniques, modifications and new practices. Rail Sciences, Inc., simulated a number of potential fuel-saving options to determine if operational changes could decrease curving resistance and corresponding fuel consumption — specifically as they relate to controlling coupler force and train speed.
A number of forces make up the resistance that is applied to moving a train. These include aerodynamic, inertial and grade forces; track deflection and suspension damping; curving resistance; and bearing and wheel/rail friction.
Many factors, such as grade forces, are inherent and cannot be changed. Curving resistance, however, is a factor that can be influenced by the drawbar force to possibly yield beneficial results. Three aspects of curving resistance were investigated as part of this study: energy loss at the wheel/rail contact patch; and energy loss relating to vertical and lateral track deflection.
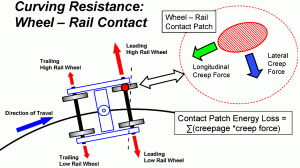
Energy loss at the contact patch is caused when wheelset movement is restrained during curving, causing relative slip at the wheel/rail contact patch. This “slip,” which is known as “creepage,” creates longitudinal and lateral forces that help dictate wheelset steering. Energy loss at the contact patch is equivalent to the creepage multiplied by the creep force, which is similar to a standard energy equation: work energy equals force multiplied by distance. Figure 1 shows a schematic that describes this energy loss.
Energy loss caused by vertical track deflection occurs through the act of a wheel depressing the track vertically as it moves along the rail. The two main aspects of vertical track deflection energy loss are track damping and track inertia. Curving at overbalance or underbalance speeds affects the individual vertical wheel loads that are imparted from the vehicle to the track. The lateral coupler load also has an effect. However, under steady-state curving conditions, the sum of the vertical wheel loads remains close to the static weight, regardless of curving conditions. Running at overbalance speeds puts more wheel load on the high rail, but reduces an equal amount of wheel load from the low rail. The sum of the vertical wheel loads remains roughly equal to the static weight of the car. Assuming a linear relationship of vertical track deflection to energy loss, the actual energy loss would be the same regardless of curving conditions. An analogy to this is that the total force seen by the floor is no different whether you stand on one foot or on two.
There is, however, an exception to this rule. During steady-state curving at balance speed, an inertial downward force is created that increases the total vertical force into the track. The centrifugal force that a train generates when traveling around a curve is similar to the downward force a racecar experiences when negotiating a banked curve. For a rail car, however, this change is less that 2% of the total vehicle static load. While the energy loss due to vertical track deflection is important and significant, it cannot be significantly changed due to coupler force and train speed. Therefore, it was not considered in the simulation analysis.
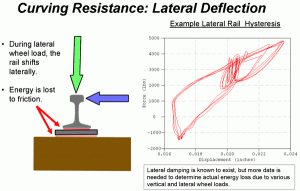
Lateral track deflection also has energy loss associated with it. Unlike vertical track deflection, however, it can be influenced by coupler force and train speed. When an individual rail is laterally displaced, there is hysterics energy loss due to the frictional sliding surfaces between the rail and tie plate/fasteners, as well as between the tie plate and tie. Sample test data (shown in Figure 2) depicts the hysteresis “loop” of energy loss as multiple wheels laterally displaced a rail during curving. Admittedly, there is not enough test data currently available to accurately assess the energy loss due to various combinations of vertical and lateral wheel forces that occur during lateral rail deflection. However, in recognition of the importance of lateral track deflection, lateral wheel force was included as a computer model output.
Simulation Parameters
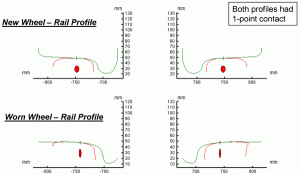
Vehicle dynamics simulations were performed to investigate the influence of coupler force and train speed on curving resistance during steady-state curving. VAMPIRE™ software was implemented for the study. Simulations included both a loaded and empty 286,000-pound coal car with Barber S-2-HD trucks. Curvatures of 2, 4, 6, 8, and 10 degrees were simulated with 1-inch underbalance superelevation of the rated curve speed. In-train forces were applied to the vehicle models. The empty car had -200 kips to 200 kips coupler force applied in 50-kip increments, the loaded car had -400 kips to 400 kips coupler force applied in 50-kip increments. A new wheel and new rail contact profile was simulated. However, an additional contact profile using moderately worn wheel and rail profiles were simulated, as well, to investigate if there are any significant profile influences on the resulting curving resistance. (Note that the moderately worn wheel and rail profiles did not have two-point contact.) Figure 3 illustrates the wheel/rail profiles used in the simulations. In total, approximately 2000 simulations were performed; however, batch pre- and post-processor programs were created to ease the workload of all the computer simulations.
Energy loss at the contact patch and lateral wheel load were evaluated as model outputs. In order to simplify the results, the “total” contact patch energy loss and “total” lateral wheel load was calculated for the vehicle model. The total lateral wheel load was intended to characterize how well the vehicle is curving by summing all of the lateral wheel forces it imparts to the rails. A good curving vehicle will impart a low total lateral wheel force, while a poor curving vehicle will impart a high total lateral wheel force.
Additionally, individual wheel L/V ratios were calculated. This was not to help determine potential curving resistance reduction, but to insure that any simulated scenarios did not have a high risk of derailment. The highest predicted L/V ratio was 0.60 for both the loaded and empty cars on a 10-degree curve at the maximum buff force. Although 0.60 is elevated for simulated “perfect” track, it did not pose a major derailment risk.
Simulation Results
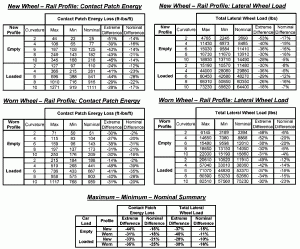
To help manage the immense amount of data that the simulations produced, the maximum, minimum, and nominal contact patch energy and lateral wheel force values were evaluated for each curvature. “Nominal” values indicate instances in which the vehicles were simulated with zero coupler force while traveling at balance curve speed. “Extreme” and “nominal” differences were calculated to evaluate the potential reduction(s) in curving resistance. The “nominal” difference was the difference between the nominal and minimum values. Figure 4 depicts the tabular results.
Results indicated that the energy loss at the contact patch and reductions in lateral wheel loads were similarly proportional. Additionally, there was no consistent difference between new and moderately worn wheel/rail profiles. Overall, the results indicated a best-case potential reduction in curving resistance of 30% – 40%; the more realistic “nominal” potential reduction would be 15% – 20%.
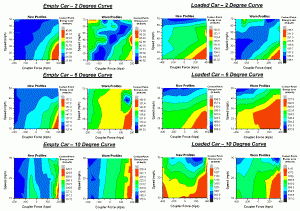
Contour plots of contact-patch energy at various coupler forces and train speeds are shown in Figure 5. (Note that blue indicates low curving resistance and red indicates high resistance. Also note that the contour plots do not have the same legend scale because of the need to maintain descriptive contour plots.) Generally, the highest curving resistance occurs at high draft coupler force and low train speeds. The lowest curving resistance generally occurs in buff coupler force and high train speeds.
These results beg the question: Why do buff force and overbalance speeds promote lowered curving resistance? Although further analysis is required to fully understand this phenomenon, the following represents an immediate explanation. The wheelsets on a perfectly curving railcar would have zero angle of attack for each wheelset, with each wheelset laterally shifted to obtain the correct rolling radii (also known as coning). To curve correctly, a wheelset must shift laterally toward the outside of the curve to obtain the correct coning action. However, draft forces and underbalance speeds would inhibit this, as they would tend to pull the wheelsets toward the inside of the curve. Buff forces and overbalance speeds would tend to shift the wheelset laterally, in the correct direction.
Overall Possible Savings
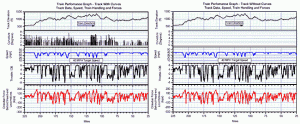
Computer simulations indicated a best-case possible reduction in curving resistance of 30% – 40%, and realistic possible reduction of 15% – 20%. However, as previously mentioned, curving resistance is just one of many factors that figure into total train resistance. To help understand the bigger picture, a full-train longitudinal simulation was analyzed to help determine the effect of curving resistance on an actual train and an actual route. TOS™ software was implemented for the study. The route was approximately 200 miles with maximum grades of +/- 1.2% and 8-degree maximum curvature. Target speeds of 30, 40, and 50 mph were applied; throttle and braking commands were determined accordingly. The main focus of the simulation was to model with and without the curves, then to compare the difference in fuel consumption. Plots of the in-train force simulations’ input and output values can be seen in Figure 6. Results indicated that removing all curves from the actual route would reduce fuel consumption by 5.1% – 8.4%.
Combining the results of the TOS™ and VAMPIRE™ simulations indicates that a best-case possible reduction of total train resistance would be 3.3%; a more realistic possible reduction of total train resistance would be 0.9%. Results also indicated that reduced curving resistance generally occurred with buff coupler forces and higher speeds.
Fuel Savings at What Cost?
Results of the study indicated that there is a potential fuel savings from modifying in-train forces and train speed. They were minimal, however: 3.3% in the best case; 0.9% in the more realistic case. In order to obtain these reductions, increases in speed, which may require additional locomotives (especially on uphill grades) are necessary. Additionally, increased speeds create increased aerodynamic resistance. Theses factors may negate any reductions in fuel consumption.
Overall, the results of this study indicate that modifying operational practices to obtain an ideal coupler force and train speed in order to reduce curving resistance may not be effective. Further work is needed to fully understand how creepage and creep forces are influenced by coupler force and train speed. Currently, there is only speculation about why buff force and overbalance speeds promote decreased curving resistance.
Another major point is that only one-point wheel/rail contact geometries were considered in this study. Two-point wheel/rail contact should also be investigated, as it would most likely yield different results. Additionally, the worn rail profiles used in the study were generic in nature. Actual rail profiles from 2-, 4-, 6-, 8-, and 10-degree curves should be obtained and simulated to better replicate real-world conditions.
Additional curving-resistance simulation work is needed to understand the effects of various vertical and lateral wheel loads, and track conditions on energy loss. Finally, the industry needs the ability to import curving resistance results directly into track/train simulation software such as TOS and TOES in order to determine curving resistance on specific routes, train make-up, locomotive configuration, and train handling scenarios.

Matthew Dick is Assistant Vice President – Engineering and Dynamic Studies; Gary Wolf is President; Jack Chislett is Director – Engineering Application of Rail Sciences, Inc.

