
Assessing the Findings of a Derailment Investigation: Was the Right Cause Found?
by Jeff Tuzik
The Great Dismal Swamp. An ominous name. And in June of 2019, it was the site of a Norfolk Southern derailment. At NS, all derailments are investigated to determine the cause(s) and to provide data that could help prevent future incidents. Brad Kerchof, formerly Director of Research & Tests at Norfolk Southern, and currently Senior Track Engineer at Global Rail North America, has investigated many derailments. And in the case of the Dismal Swamp derailment, he asks: was the right cause found?
The Great Dismal Swamp National Wildlife Reserve overlaps Norfolk Southern’s Bluefield-Norfolk mainline. This is where unit coal train 820 derailed. The investigation of the derailment took place shortly after Kerchof’s retirement from NS, and he was therefore not part of the investigation—but he is very familiar with the relevant data, and had previously led many of NS’s derailment investigations. He provided his analysis of the final report on the derailment at the 2024 Wheel/Rail Interaction Heavy Haul Conference.
Train 820 derailed at milepost N15.7 (Norfolk is located at N0) while traveling eastbound at 50 mph; 36 cars (designated cars 45-80) derailed. “Two questions should be asked at the start of a derailment investigation,” Kerchof said. “What’s the point of derailment (POD), and which car was the first to derail?”
In this case, investigators determined that the first car to derail was likely car 46. “Investigators likely determined this based on ballast marks on the wheel treads,” Kerchof said. The POD couldn’t be determined initially via site inspection, since the site was likely buried under ≈500 ft of mangled metal and coal, he said.
According to NS investigators, the first five cars rolled on their sides, causing the following 31 cars to accordion in a pileup. Likely causes of a derailment of this nature include a broken rail, a burned-off journal bearing, a broken wheel, or a broken axle, Kerchof said. He added that some causes could be excluded, such as train handling—because the cars were all loaded and travelling on level grade—and a wheel-climb initiated derailment, because no wheel marks were found on the ground leading to the pile-up.
In addition to inspections at the derailment site, there are also important transportation-related elements to include in any investigation: the locomotive event recorder, forward-facing camera footage, and train crew interviews. The mechanical aspect of the investigation should also include wheel impact load detector (WILD) data, and inspection of the wheel treads on the last good cars (the cars immediately in front of the derailed cars): “This is where you want to look for impact marks associated with a broken rail,” Kerchof said.
On the track side, he said that important data to consider includes the most recent track geometry inspection data, downward facing camera images (from the geometry car), vehicle/track interaction results, and recent rail-flaw inspection results.
The Site
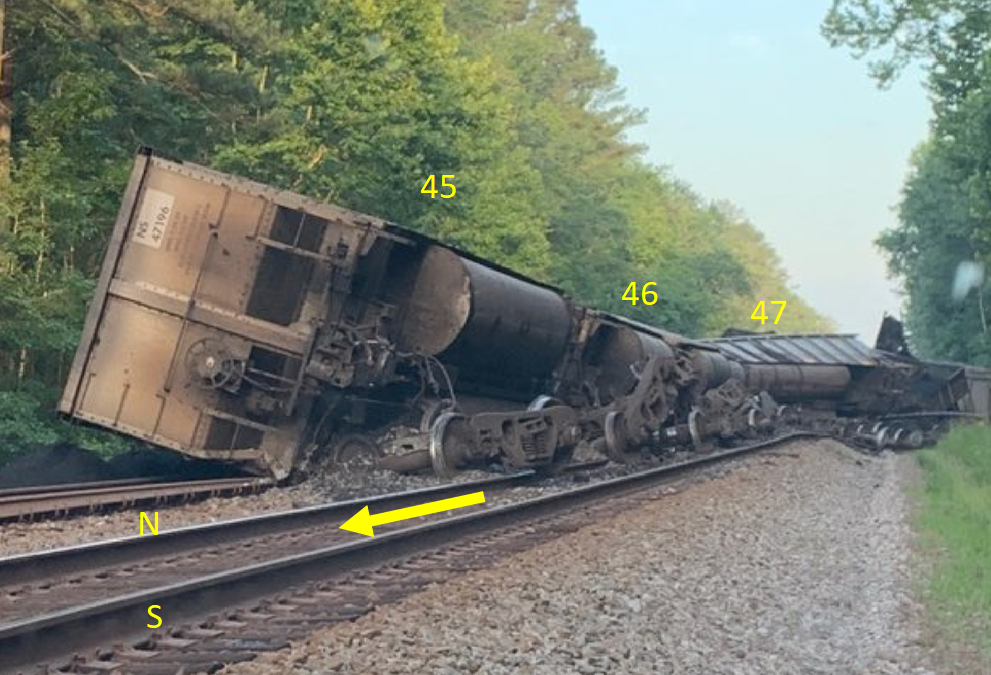
The mechanical inspection of the derailment found a broken wheel on the lead truck of the third derailed car (car 47). This was determined to be a result of the derailment, rather than a cause, due to ballast marks on the tread, indicating that the wheel failed sometime after it contacted the ballast. Investigators also found rail abrasion marks on the bottom, inboard side of the south-side side frame of car 45 (the first derailed car), Kerchof said. On car 47, investigators found a broken rail piercing the south-side of the truck bolster; “This means either the south rail would’ve had to raise up to bolster-level, or the bolster dropped down to rail-level.” Figure 1 shows the location of these cars and the orientation of the north and south rails.
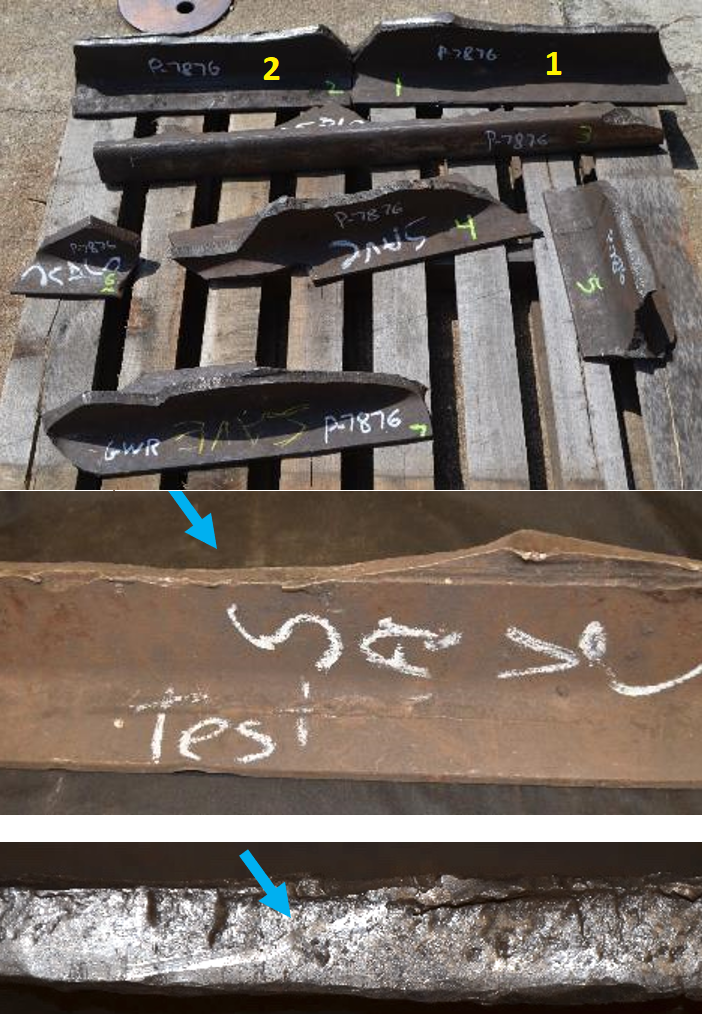
The track inspection of the site turned up a few more pieces of the puzzle; seven small pieces of broken rail. Pieces 1 and 2 (see figure 2) were particularly important, Kerchof said, because they showed evidence of wheel tread contact on the web of the rail. “That’s only possible if the rail head breaks off and wheel treads run along the web while the rail base is still sitting in the tie plates.” Unfortunately, whether these pieces came from the north or south rail could not be determined, as none were large enough to include a brand. Investigators also identified other broken rails, but none of these contained an initiating defect, he said, so a causal rail failure could not be confirmed.
The locomotive event recorder showed nothing anomalous, the throttle setting suggesting only “light-to-moderate draft forces in a steady state” per NS’s report. A close review of the forward-facing locomotive camera noted a “small discontinuity on the gage side of the South rail head,” but also noted that had the location not been marked as close to the suspected POD, this discontinuity would “likely not be considered significant.” As there is no mention in the official report, it seems that no relevant information was obtained from crew interviews, Kerchof said.
Mechanical Analysis
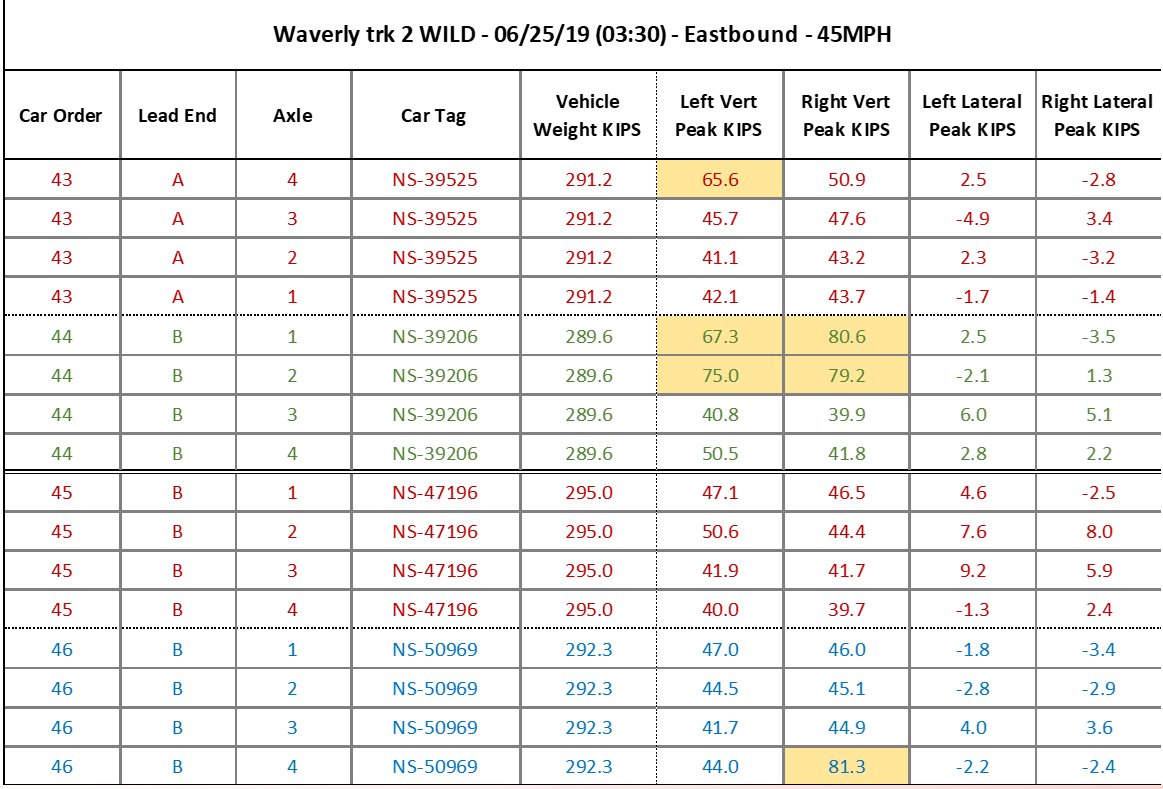
Kerchof pointed out that the WILD data used in the investigation was obtained from a detector in Waverly, roughly 50 miles from the POD, meaning that the data represents conditions roughly one hour prior to the derailment. Data from the last two good cars and the first two derailed cars is shown in figure 3. Though the data for peak vertical kips shows evidence of some out-of-round wheels, nothing is severe enough to trigger a wheel changeout, he said. Peak lateral kips are similarly unremarkable. “In the context of lateral over vertical loads, you’re looking at a peak L/V of 0.2 or 0.3—nothing that would cause a derailment.”
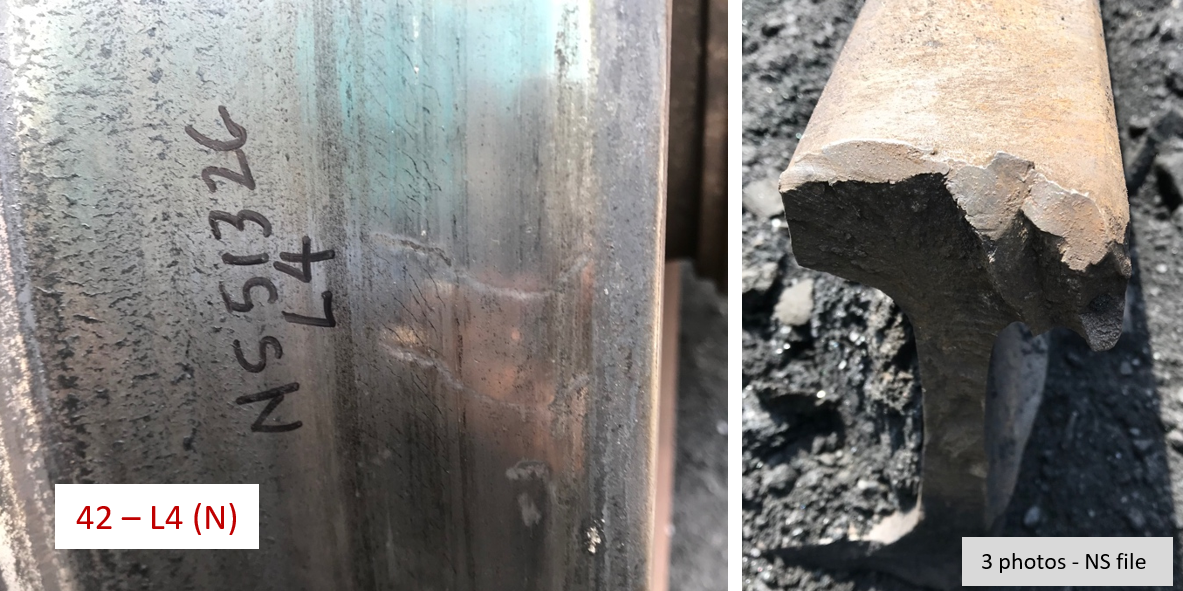
Close analysis of the wheel treads found impact marks on three of the last good cars, some of them indicating very forceful strikes. “To get a dent like this in a wheel tread, you’ve got to have a fairly heavy car a high-impact situation such as when the wheel falls to the ground and then strikes the face of the broken rail,” Kerchof said. Figure 4 shows such a wheel impact mark, and the battered end of a broken rail at the derailment site. The broken rail piece showed evidence of both tread and flange impacts. “This was certainly involved in the derailment, but the fracture face [of the broken rail] showed no defect,” he said. As was the case with the broken wheel from car 47, this indicates a result rather than cause.
Impact marks were found on the north-side wheels of cars 42 and 43, both of which were traveling with the A-end in the lead, and on the north- and south-side wheels of car 44 (the last car to not derail) which was traveling with the B-end forward.
Track Analysis
Track geometry and track chart data provided an overview of the derailment site:
- Tangent track
- 0.04% descending grade (effectively level)
- South rail type: 132RE Illinois Steel September 1981
- North rail type: 132RE Bethlehem Steel September 1981
- Gage, surface and alignment met relevant FRA class 4 standards, based on a test three weeks prior to the derailment
- Downward-facing cameras showed a clean running surface (no RCF) on both rails
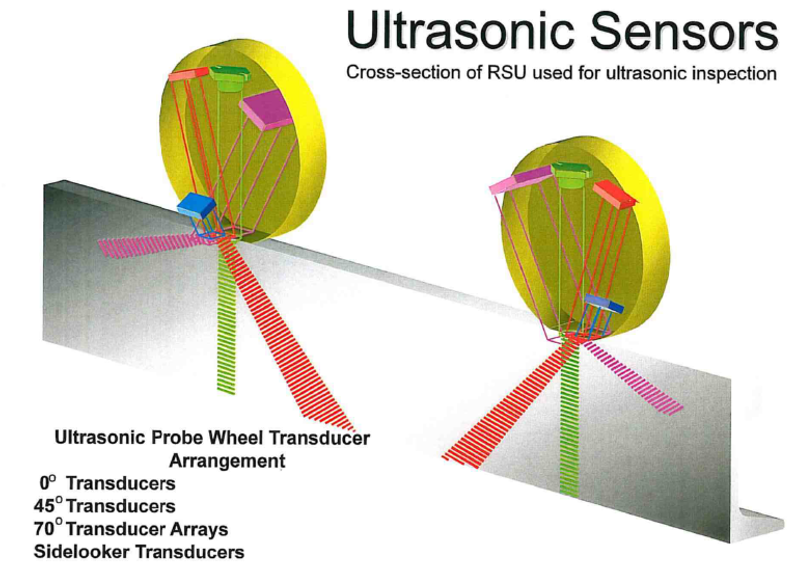
Sperry Rail Service performs internal flaw detection on NS. Figure 5 shows a diagram of the ultrasonic sensor array Sperry used circa 2019. The 2-dimensional location, shape, and thus, the likely type, of internal flaw (if present) is represented by the collection of transducer responses it triggers, Kerchof said. These tests produce brightness-scan charts, often called B-scans, which show a side-view of the rail in 10-foot sections.
Ultrasonic testing was performed on the track in both February and May of 2019, prior to the June derailment. The February test triggered 70-degree, 45-degree, and side-looker (which takes a scan perpendicular to the rail) transducer responses on the south rail over a distance of 36 feet, indicating a potential vertical split head, he said. This was a start-and-stop test, meaning the inspection took place at low speeds and stopped for hand test verifications. At the time, however, hand testing at this location was negative; it did not confirm an internal defect.
The May 2019 test of the same location and rail did not reproduce the same 70- and 45-degree transducer responses, although it did trigger a similar side-looker response, but now spanning a distance of 37.5 feet, Kerchof said. The May test was also different in that it was a continuous test, meaning the operation took place at higher speed and did not stop for hand-test verification. Hand testing was only done (the next day) if there was a change in the data from the previous test, such as the appearance of a new potential defect. In this case, the differences between the February and May tests did not meet the criteria for follow-up hand-testing.

Sperry and NS determined that the differences in signal response between the two tests were due to “excessive beam scatter and not to specific internal defects,” according to the official report. The report continues: “Since rail containing an initiating defect was not recovered from the derailment site, the defect type and location (north vs. south rail) could not be determined.” The report concludes that the derailment was initiated by a “broken rail of unknown origin” and given the FRA Cause Code T207 Broken Rail – Detail Fracture from shelling or head check, Kerchof said.
The Cause
Was this the true cause of the derailment? Kerchof thinks not. The rail surface condition at the time of derailment was clean; there was no shelling or head checks, he said. “The transducer responses were not beam-scatter due to a surface condition, because there was no RCF.” In order to produce a beam-scattering response in an ultrasonic flaw detector, RCF has to be present and quite severe, easily visible to the naked eye, he said. Based on all the evidence gathered by investigators and a close reading of the Sperry B-scans, he surmises that the transducer responses in May and February of 2019 reflected a real internal defect.
The total length of side-looker transducer response in the May 2019 ultrasonic test was 37.5 feet. In 1981, when the rail at the derailment site was produced, mills produced rail in 39-foot lengths. “And what type of defects tend to run the entire length of the rail? Split webs, pipe rail, head and web defects, and vertical split heads (VSH),” Kerchof said.
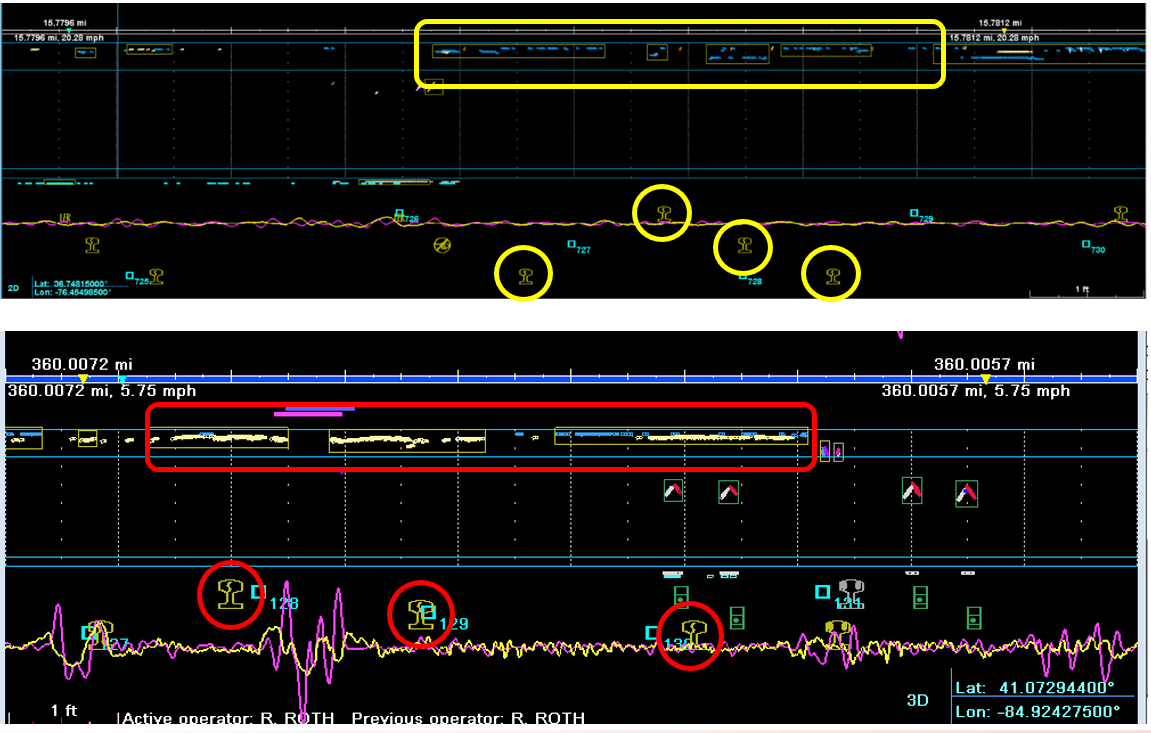
Kerchof compared the data, including B-scans, of the Dismal Swamp derailment with another derailment (in New Haven, Indiana) that he had investigated — one that was unquestionably due to a VSH. There were many similarities. In both cases there were “intermittent side-looker transducer responses that were long enough to trigger Sperry’s VSH pattern recognition,” he said. Figure 6 shows a comparison of Dismal Swamp (top) and New Haven (bottom) B-scans.
The final resting position of the first four derailed cars in the Dismal Swamp derailment holds another piece of evidence. In order to fall to the south side, the wheels on that side would have to fall first, indicating that the south rail was the first to break. Combined with all the other evidence, including the rail abrasion mark on the south side of the side frame of the first car to derail, and the wheel tread impact marks on the web of the north rail, Kerchof said that the majority of the evidence points to one conclusion; “I’m convinced we had a south rail VSH in the Dismal Swamp.”
The only piece of evidence that supports another conclusion was impact marks consistent with a broken rail strike on multiple wheels on the north side of the last three good cars, he said. But this alone stands against significantly more evidence indicating the south rail.
As is the case with most derailment investigations, the Dismal Swamp investigation touched on nearly every aspect of wheel/rail and vehicle/track interaction and provides an opportunity for a deeper understanding of the interplay of these systems. A case like this, in which there is also a kind of investigation of an investigation, illustrates some of the ways in which extant measurement and condition monitoring technologies like track geometry cars, WILDs, ultrasonic testing, can be leveraged as investigative technologies—the data is there, but sometimes it takes a different perspective to pull the information from it.

Jeff Tuzik is Managing Editor of Interface Journal.
This article is based on a presentation made at the 2024 Heavy Haul Wheel Rail Interaction conference.
All illustrations courtesy of Norfolk Southern / Brad Kerchof.