
Extending Wheel Life Through Rail Grinding

by Jeff Tuzik
Rail grinding is typically the go-to approach to addressing rail-related issues like corrugation, RCF, profile degradation, and a slew of others. It works. And on transit (and other closed-loop) systems, rail grinding can also be used to address wheel-related issues, as well.
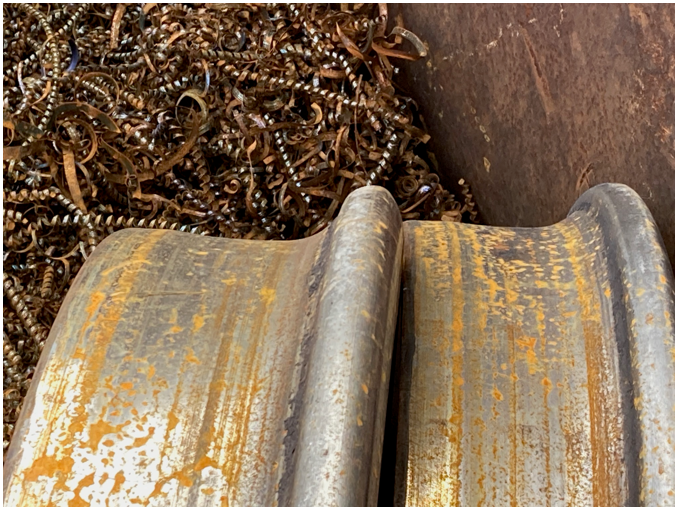
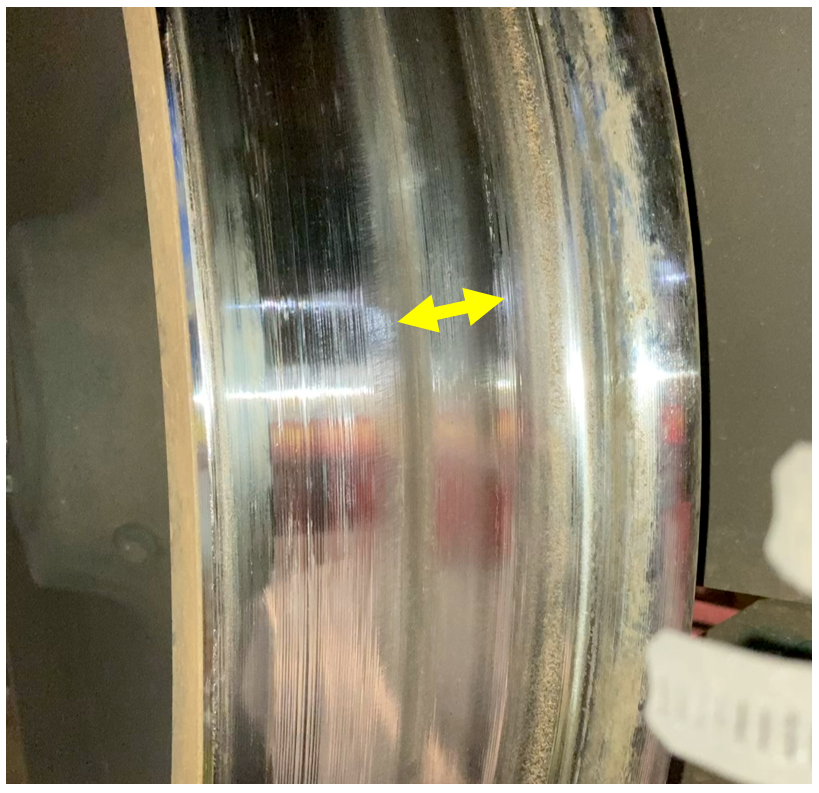
Greater Cleveland Rail Transit Authority’s (RTA) Red Line, which has operated since 1955 and now comprises 19 route-miles had never performed rail grinding prior to 2023. The agency’s decision to do so had more to do with excessive wheel tread wear than rail wear. Wheels on the Red Line’s fleet, prior to the 2023 grinding operation, had a historical wear rate of ≈1/16 inch per month from a combination of wear and wheel truing, Brad Kerchof, Senior Track Engineer for Global Rail North America, told attendees at the 2025 Wheel/Rail Interaction Rail Transit Conference. “The RTA’s standard 28-inch wheel reaches its replacement limit at 26 inches, which means 2 inches of diameter wear or 1 inch of tread wear.” See figure 1 for an example of condemned hollow-worn wheels from the Red Line.
These wear figures mean that the average wheel on the Red Line fleet has only a 13-month, or ≈77,000-mile, lifespan. “Compare this to another transit I know of, where the first wheel truing occurs at 80,000 miles,” Kerchof said. While there is a wide range of wheel life statistics among transit systems, the Red Line’s figures clearly needed improvement.
Although the Red Line’s wheels wore quickly, they experienced only tread wear; there was virtually no flange wear, Kerchof said. The likely reasons behind this wear pattern were twofold: the RTA has a “very effective” gage-face lubrication program, and there are restraining rails on all curves of greater than 6 degrees, he said.
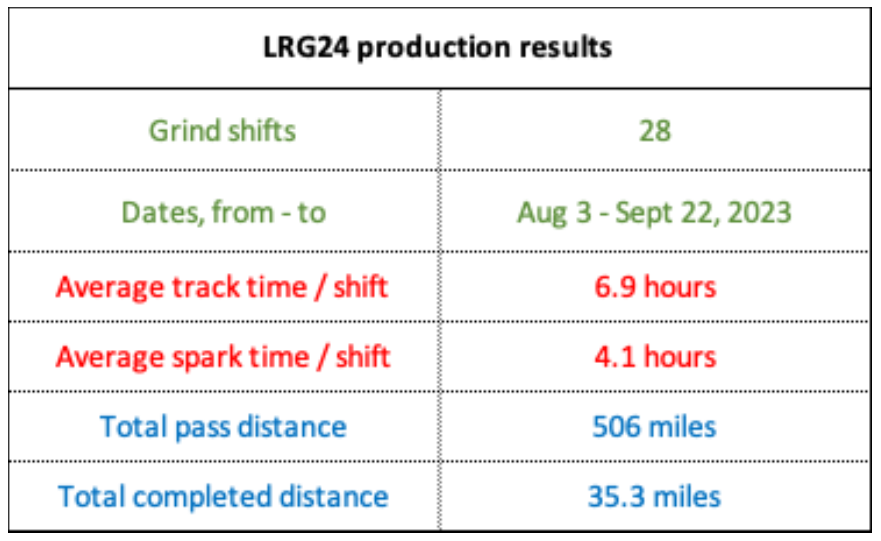
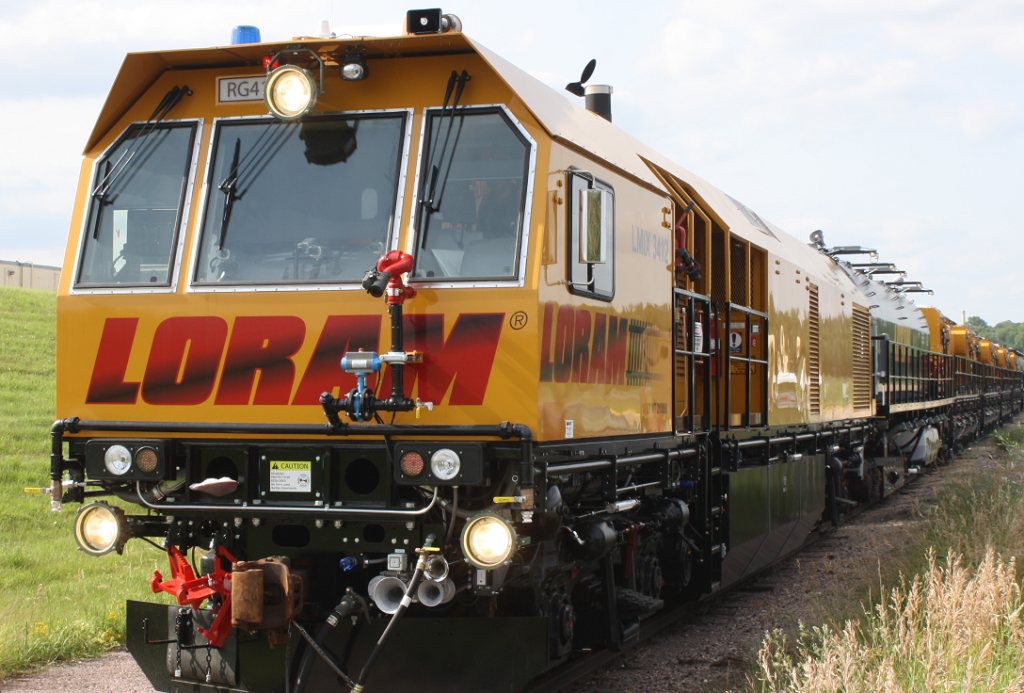
The RTA initiated a grind program in 2023, working with Global Rail North America (GRNA) and Loram. In order to maximize efficiency, RTA single-tracked revenue service around grinding operations to allow for 8-hour grinding shifts, Kerchof said (Video 1 shows the grinder operating while revenue service continues on the adjacent track). This is uncommon (but not unheard of) among transit systems, which often have very short maintenance windows, often providing no more than 90 minutes of spark time. Figure 2 shows production results from the entire grinding program. The average track time per shift (6.9 hours), and average spark time per shift (4.1 hours) allowed for an unusually high rate of production.
The long track blocks and high productivity rates were necessary, however, to complete the grinding program to RTA’s specifications. The16-stone grinder typically performed 15 passes on tangent sections, and 25 passes on curves, Kerchof said. This is a fairly high number of passes, indicative of a significant corrective/re-profiling grinding effort.
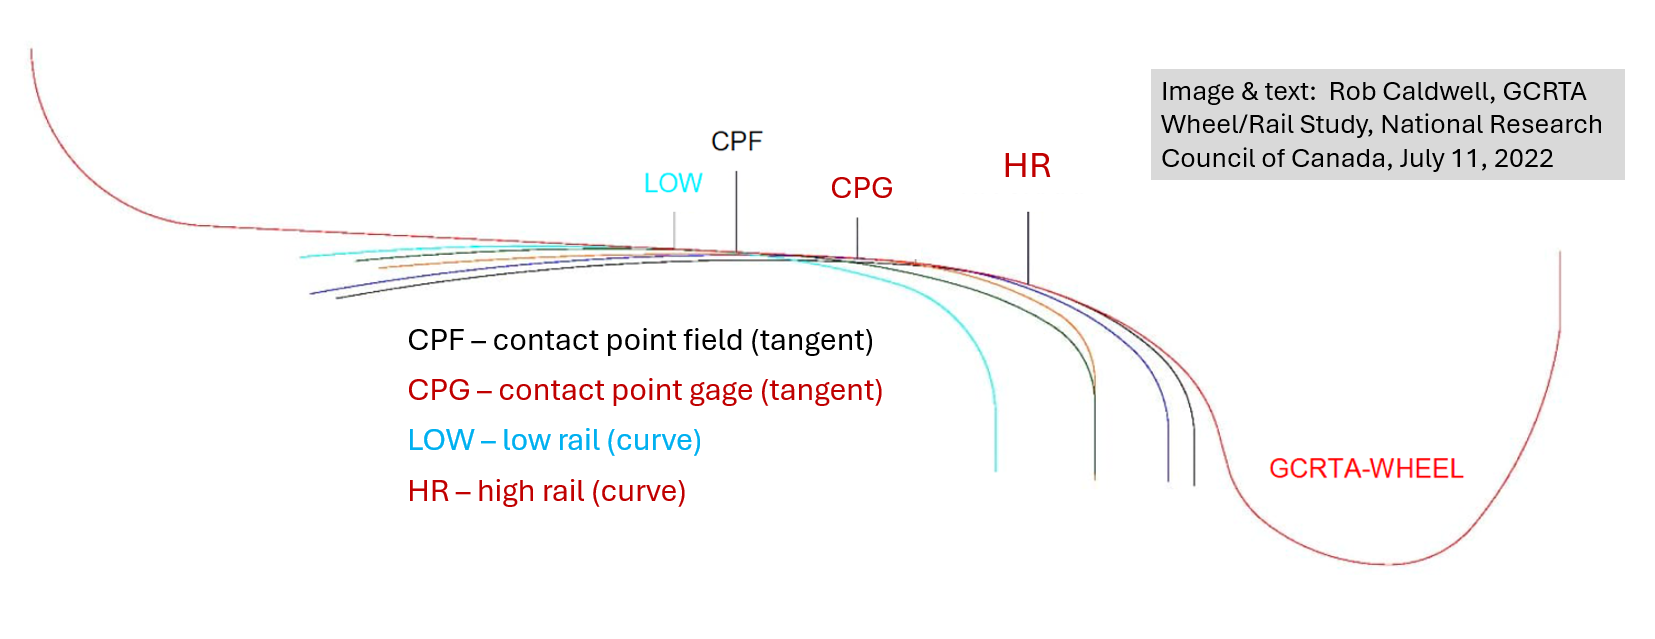
The grinding program called for the implementation of four new rail profiles developed by the National Research Council of Canada (NRC). These included contact point gage (CPG) and contact point field (CPF) profiles for tangent track, and low rail and high rail profiles for curves, Kerchof said. The use of two profiles for tangents is a strategy developed by NRC to distribute rail contact across a wider part of the wheel tread, rather than having the same wheel/rail contact point throughout the entire system. Figure 3 shows where each of the four rail profiles are designed to contact the wheel. The contact points shown in Figure 3 assume standard gage, but “variations in track gage will further contribute to the distribution of wheel tread wear.” In other words, the objective is to reduce the rate of tread hollowing by increasing the width of wheel tread that contacts the rail.
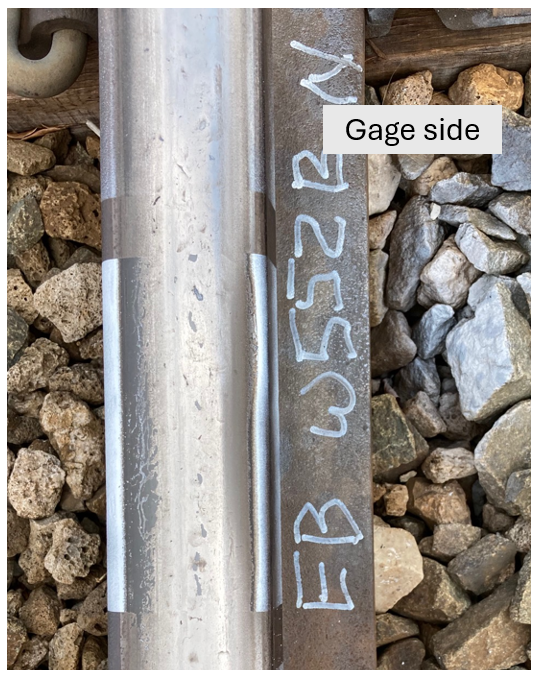
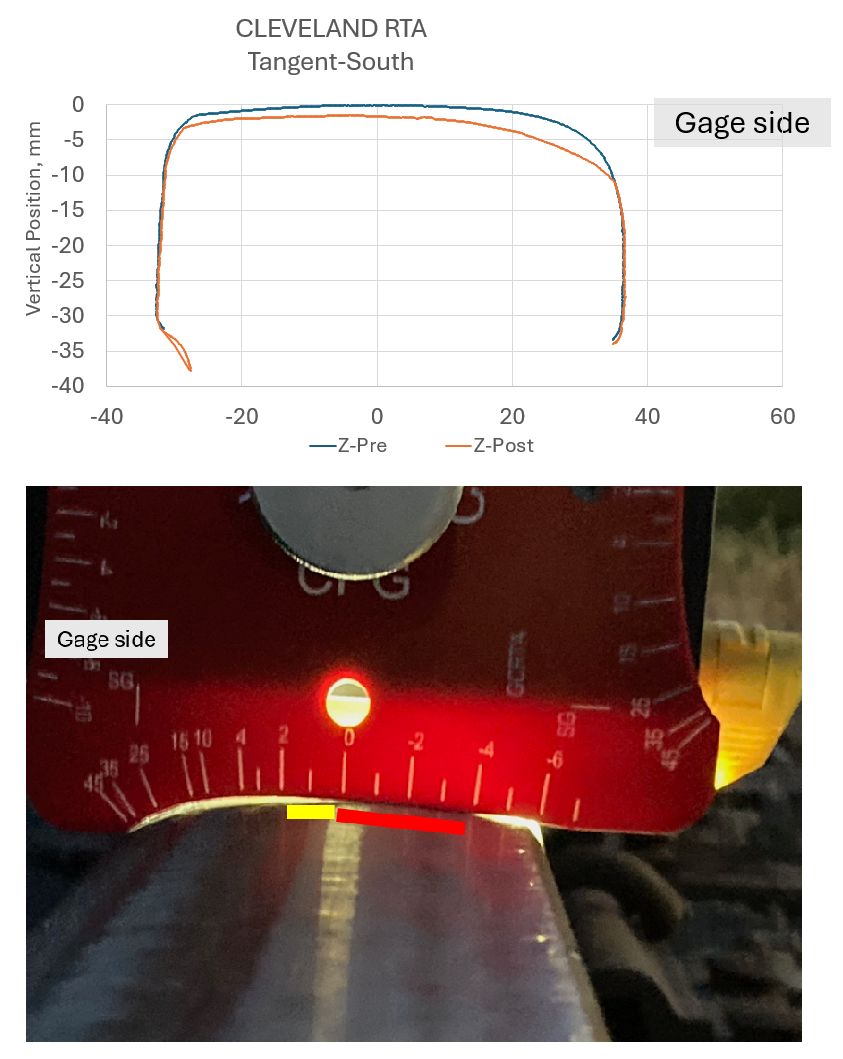
Figure 4 shows the wheel contact band on a pre-grind rail. Note that the contact band covers the entire width of the rail head, which indicates a very flat rail profile. Measurements confirmed this to be the case. Figure 5 (top) shows the pre-grind profile (blue) overlaid with the new CPF profile (red). The large gap on the gage side indicates the high amount of metal removal required to reach the desired profile. The lower image in Figure 5 shows a CPG rail gauge on pre-grind rail; the yellow line indicates the desired contact point and red line indicates where significant metal removal is necessary.
See Video 2 for under-car footage of pre-grind wheel/rail contact conditions on the Red Line.
Post-Grind Conditions

“In Cleveland, our primary grind quality method was visual inspection,” Kerchof said. While optical rail profile data was collected by a KLD system mounted on the grinder and was used to calculate a grind quality index (GQI), the grinding team didn’t use GQI to guide the grinding program. “We used a manual bar gauge and the KLD rail profile graphs to determine our next grind pattern. And we relied on visual rail inspections for our quality check —if the wheel contact band was where we wanted it, we were satisfied,” he said. (The team also used MiniProf measurements, but in an ancillary manner.)
One month after the grinding program, the differences in the contact band between CPF and CPG were clear: Figure 6 shows these different contact bands with CPF on the left and CPG on the right. The rail centerline is marked in red. Video 3 shows two clips, the first is post-grind footage of the CPF profile, and the second shows the CPG profile. “Post-grind ride quality was excellent. We had no hunting at all,” Kerchof said.
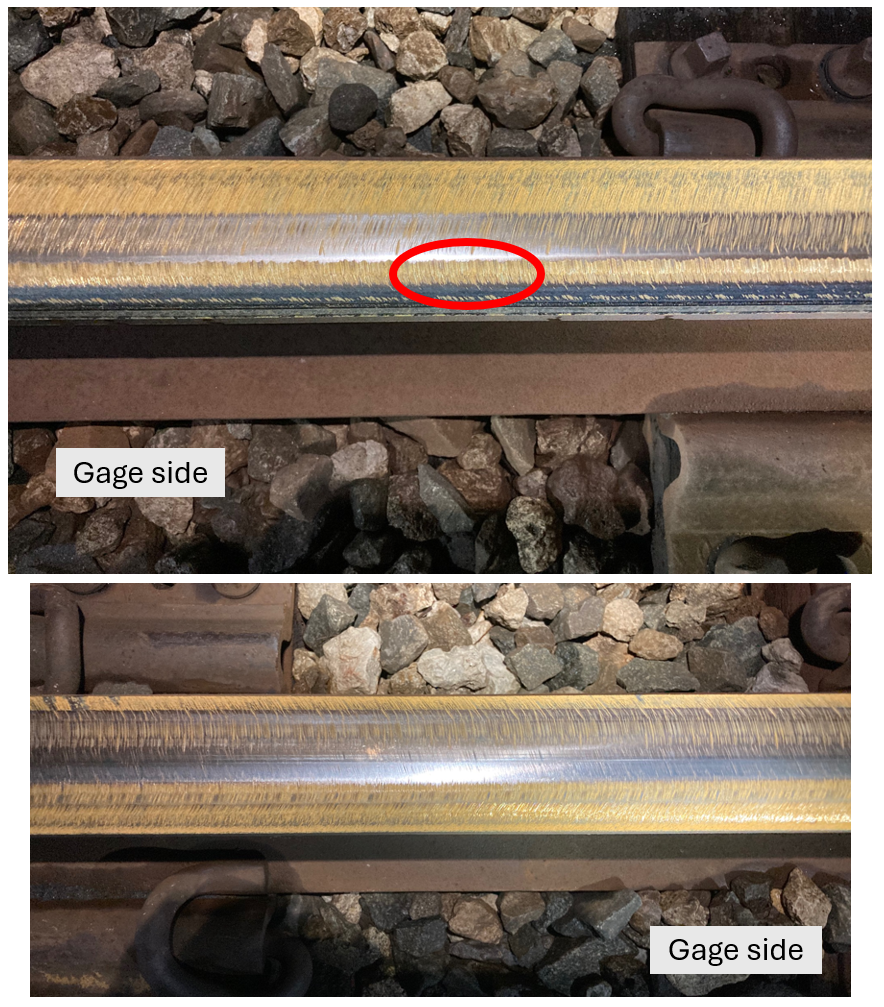
Implementation of the high rail profile was less successful. “On several curves we took a little too much off the gage corner and ended up with two-point contact,” Kerchof said. An example of two-point contact is clearly visible in photos taken roughly one week after grinding (see Figure 7, top image). The low rail profile, however, was well-implemented, with the contact band focused on the rail centerline, as planned (Figure 7, bottom image).
Video 4 shows two clips, the first is footage of the post-grind high rail profile, the second is footage of the post-grind low rail profile. “Ideally, on the high rail, you want the wheel to be running on its flange root, the location of maximum rolling radius,” Kerchof said.
The wheel shown in all the post-grind videos was re-trued to an industry-standard APTA 220 profile immediately prior to capturing the footage in Videos 3 and 4. After running for ≈27 miles on predominantly post-grind track, a ¾ inch-wide rail contact band was evident, Kerchof said. (See Figure 8). This represents the type of evened-out wear distribution that the new rail profiles were designed to encourage.
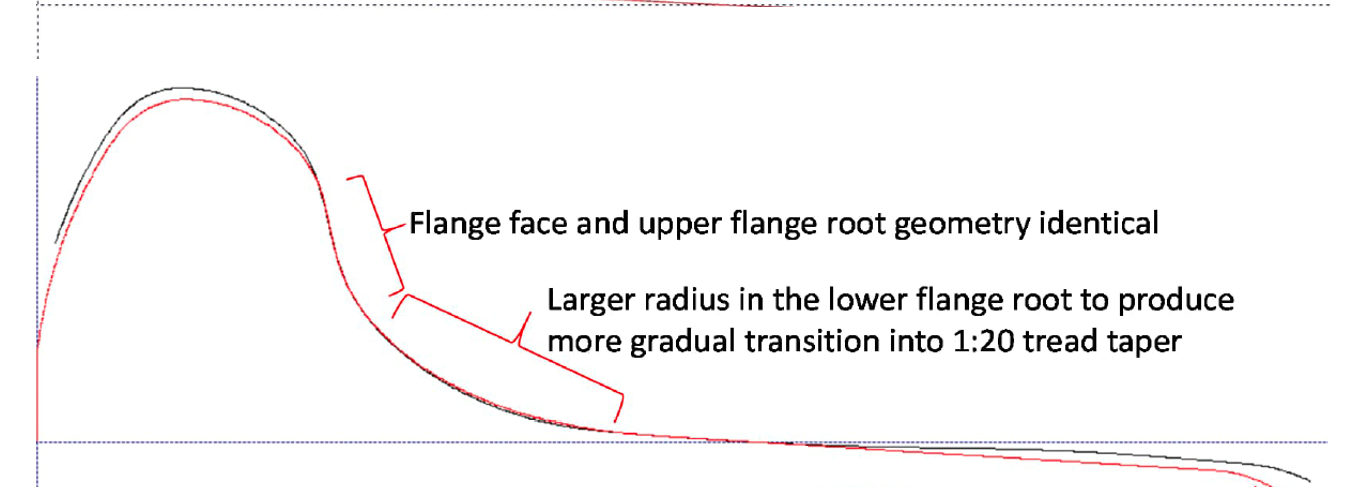
To complement the new rail profiles, the NRC also developed a new wheel profile for RTA. This profile was heavily based on the Red Line fleet’s average worn wheel, Kerchof said. Figure 9 shows the new profile (NRC RTA) superimposed on RTA’s average worn wheel. RTA began truing wheels to the new NRC RTA profile in November of 2024, but will continue installing new wheelsets with the standard APTA 220 profile until the inventory of these wheelsets is used up.
Post-Grind Wheel Life
Data collected two years out from the rail grinding program has allowed the RTA to determine the effect that the program has had on wheel life, and allowed for a more accurate prediction of future wheel life. Figure 9 shows a probability density chart indicating the average pre-grinding wheel life of ≈77,000 miles (in blue). The orange distribution shows wheelsets that were put into service after the grinding operation. “The distribution is quite different; it has shifted to the right, toward a higher average wheel life,” said Gustavo Silva, a consultant with Global Rail North America. This represents a 53% increase [from 77,000 to ≈118,000 miles] in average wheel life.”
This data represents educated predictions of wheel life based on measurements, but they are estimates, nonetheless. “There are traps you can fall into when estimating wheel life,” Silva said. One of these traps is over- or underestimating wheel life based on too few data points. Trying to fit a curve to a single measurement, for example, may indicate a wheel will last 1,000,000 miles. It won’t. “I don’t think you can accurately predict wheel life if the wheel hasn’t been re-trued at least once,” he said.
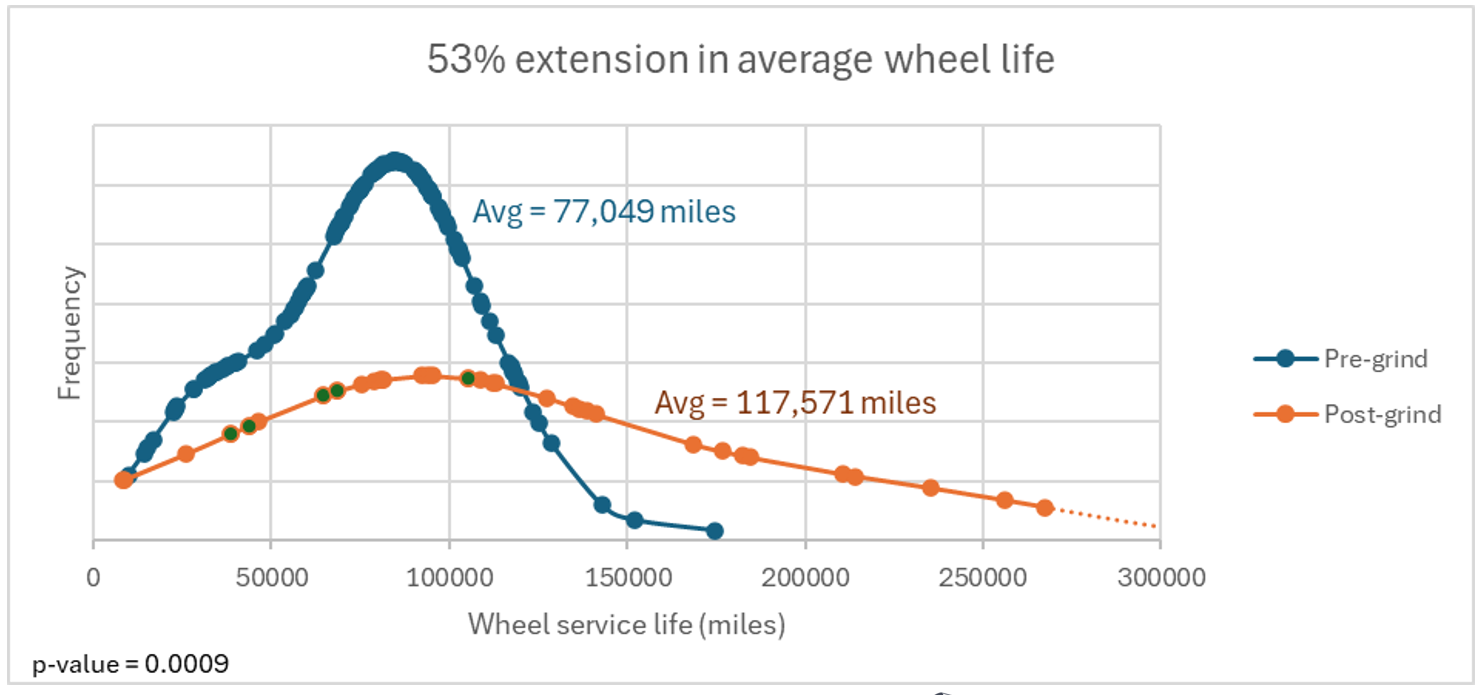
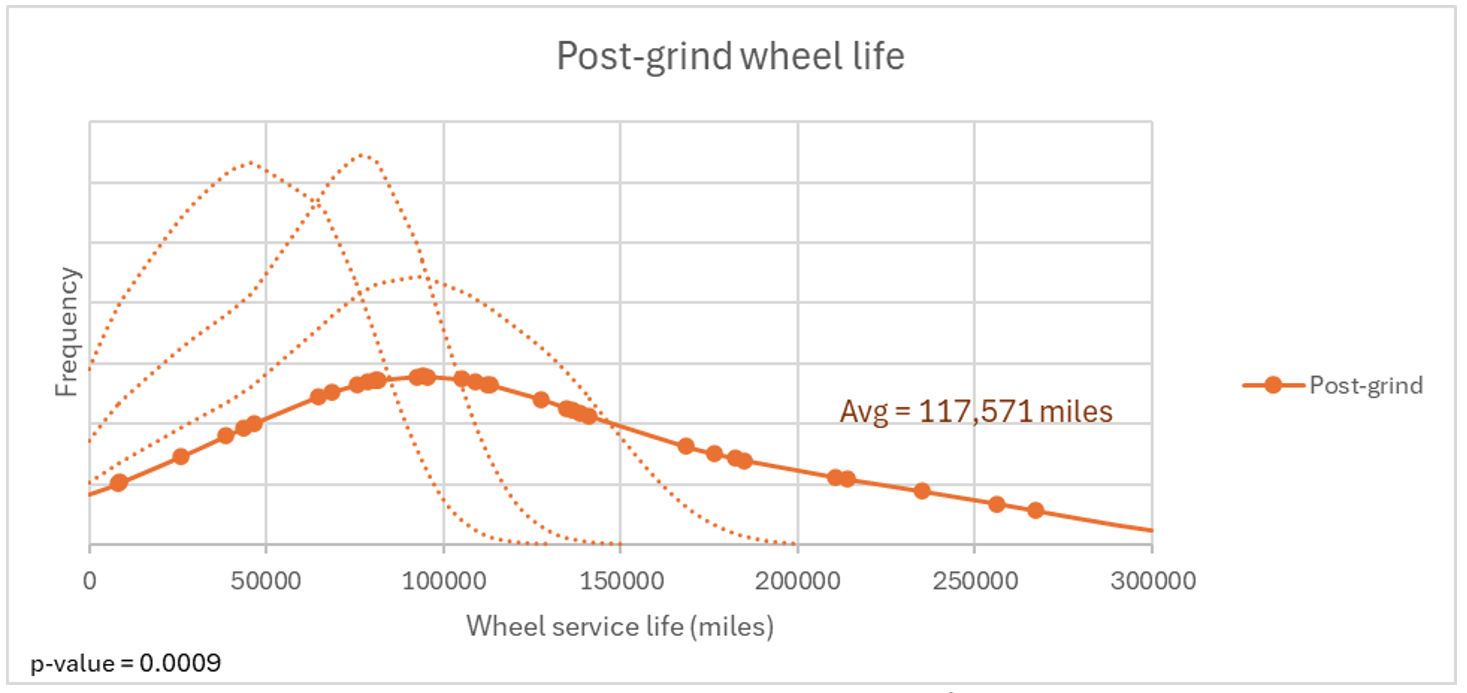
It’s important to note that the green dots arranged along the orange curve in Figure 10 represent the only wheels that have reached their condemning limit since the grinding operation; they are the only data points that reflect a full wheel life. The other points are predictions. Predictions are necessary, though, in order to draw conclusions that aren’t heavily biased toward the “worst-case-scenario outliers” that reached their wear limits prematurely, compared to the bulk of the wheels in the fleet, Silva said. As more wheels reach their condemning limits, including those with significantly longer service lives, the distribution will begin to flatten (see Figure 11). But since the Red Line has many wheels in service that have not yet hit their condemning limit, they are technically excluded from the dataset, he said.
There is also visual evidence supporting the predicted wheel life increase. The post-grind rail itself holds the clearest evidence, Brad Kerchof said. The CPF and CPG tangent profiles successfully shifted wheel/rail contact conditions and resulted in (on tangent and low rails) a series of single-point contacts that are distributed across the wheel tread. And the post-grind curve profiles take advantage of wheel radius differentials to promote better wheelset steering, which means less wheel/rail friction, which means less wear, he said. Truing wheels to the new NRC RTA wheel profile (which the RTA began in November 2024) further promotes the improved steering characteristics of the wheel profiles.
“Previously, when wheels were trued to the APTA 220 profile, they had to go through a break in period to achieve the average worn profile,” Kerchof said. “Every time they were re-trued, they had to go through the break in period again—three to four times over their lifespan.” This represents a lot of unnecessary wheel and rail wear.
Although the rail grinding portion of the program has concluded, the findings and benefits from the program are ongoing. It will take time for the benefits to fully work through the system. The RTA still has a stock of APTA 220 wheels and it will take some time for the fleet to be completely converted to the NRC RTA profile. And the effects of rail grinding are not as immediately identifiable on wheels as they are on rail. But even at this early stage, there is good evidence that wheel wear on the RTA is moving in the right direction.

Jeff Tuzik is Managing Editor of Interface Journal
This article is based on a presentation made at the 2025 Wheel/Rail Interaction Rail Transit Conference.
All images are courtesy of Brad Kerchof and the Greater Cleveland Rail Transit Authority except where otherwise noted.