Maintenance Optimization and The State of Good Repair
By Jeff Tuzik
The State of Good Repair is a goal, but it’s also a process. It’s achieved through a series of instruments and instrumental decisions that aim to report on the health of a system from the most granular component level, to the broadest holistic overview. This Part 2 coverage of the WRI 2022 Rail Transit Conference featured speakers from around the world who discussed some of the tools and strategies that transit systems are using to monitor and improve the health of their assets.
This First Step
The design and build phases lay the groundwork for an optimized system. Missteps here can cause long-lasting issues that can affect system-wide health for years. One of the issues many transit systems face is that there are a number of different standards regarding track infrastructure design that vary from system to system.

Many transit systems copy designs, such as curve or turnout templates, that are known to function on other established properties, but run into compatibility issues due to a mismatch with their own internal standards, said Wyman Jones, Director of Rail Operations Engineering at Los Angeles Metropolitan Transit Authority.
In one example from the LA Metro, a specific European turnout design was adopted and modified for the system’s #8 (yard), and #10 (mainline) turnouts. The modifications to the design, combined with LA Metro’s specific vehicle characteristics resulted in significant wheel climb and derailment risk, Jones said. Further analysis of the turnouts showed them to be unsuitable for operation at their intended speeds, resulting in significant slow orders.
This highlights several important aspects of the design/build phase: it’s important to take a holistic approach to system design. Physical testing of the design spec in-situ is critical — every track section has unique characteristics even if design specifications are identical. Detailed simulation of the system is another powerful tool, one that can identify issues before implementation, and help optimize extant conditions.
Simulation
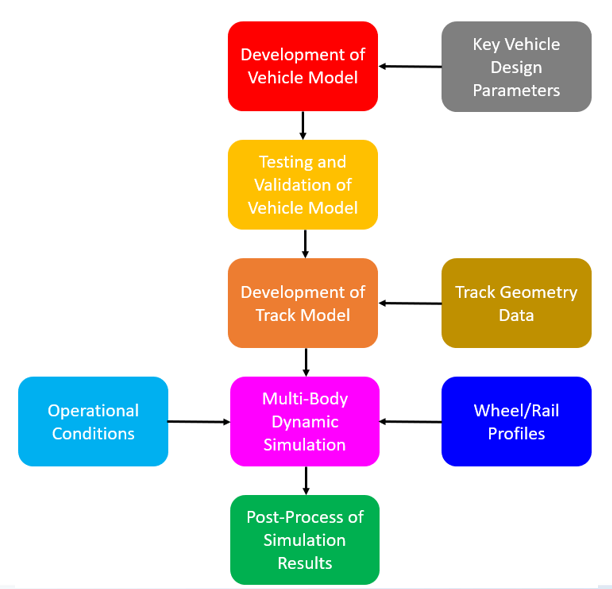
As transit systems collect more data from more sources on the state of their assets, the potential for leveraging that data increases too. A team of researchers at Monash University’s Institute of Railway Technology is in the process of developing and refining a robust dynamic simulation package focused on the wheel/rail interface. The project combines expertise from engineers in the railway sector with AI and machine learning, and a number of established physics simulation packages including Universal Mechanism (Laboratory of Computational Mechanics), Vampire Pro (SNC-Lavalin), NUCARS (MxV Rail), SIMPACK (BS Dassault Systemes), and GENSYS (AB DEsolver). “Simulations are uniquely powerful because they allow you to look at the what-ifs that are often impossible to test in the field, and to test to the extreme margins of the operating envelope,” said Rob Lambert, Senior Business Manager at Monash University Institute of Railway Technology.
The IRT project primarily focuses on the following input variables:
- Vehicle speed
- Friction levels (which vary across the rail head)
- Track gauge
- Macro geometry (alignment, cant, superelevation)
- Track defects
A simulation is only as good as the input data. For the best possible accuracy, it’s important that the input data match the real-world conditions. “If you’re looking at design profiles rather than measured profiles, you’re limiting the accuracy of the simulation,” Lambert said. Based on these inputs, the simulation models the following outputs:
- Specific energy
- Contact forces and stresses
- L/V ratios, creep forces, angle of attack
- Contact patch details.
Further post-processing of these outputs can generate information on secondary effects like wear and rolling contact fatigue (RCF), flange climb risk, wheel unloading, subsurface stresses, deformation, and fatigue behaviors. Finally, the IRT model can correlate these elements and the data can be turned into accessible and actionable information, such as wear index values, and RCF shakedown indices.
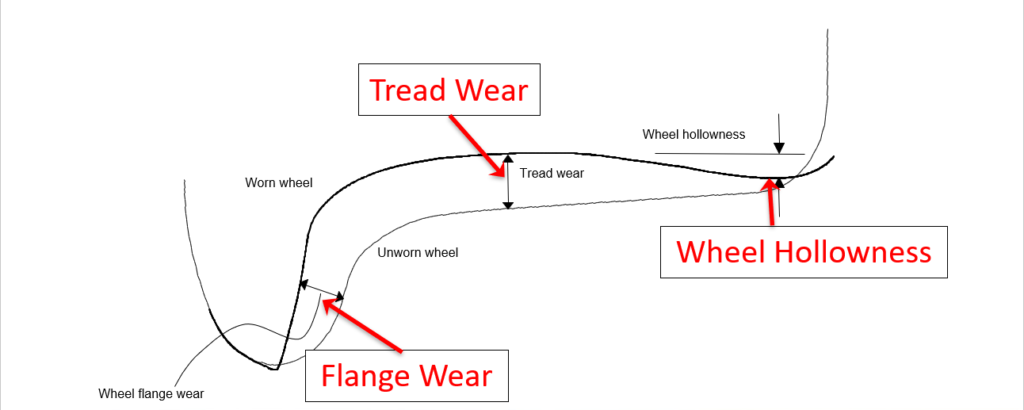
The Monash IRT team has begun to test their simulation package in various real-world settings. One such case study focused on a transit system with a particularly troublesome 400m curve presenting various defects, including heavy RCF on the gauge corner. Wheels encountering this track section were also experiencing heavy flange wear and hollow wear early in their life cycle. This in turn caused severe vehicle instability and vibration in the vehicle cabin. Initial simulations of the system based on collected data mirrored the real-world conditions and indicated a mismatch between wheel and rail profiles.
This raised the question of whether to adjust wheel profile, the rail profile, or both. Additional simulation indicated that, based on minimizing metal removal, the optimal path was to modify the wheel profile significantly, while making only minor modifications to the rail profile.
The primary modification of the wheel profile was to increase conicity. The extant profile had a very flat profile, said Lambert, which can improve ride comfort, but negatively impacts steering — hence the very high flange wear. It was also discovered during the study that the original wheel profile was in fact designed to match a rail profile from a different section of the system. “This shows that not enough thought was put into the procurement process to make sure that all the rail matched the wheel profile. If this had been done before hand, it would have sidestepped a lot of these issues,” Lambert said.
In this case, simulations also indicated that it was important for the new wheel profile to be implemented quickly across the fleet in order to reduce further damage and abnormal wear to the track.
To validate their findings, the IRT team instrumented a number of vehicles to gauge performance of the new wheel profiles. While the new profile did improve stability, ride comfort, and hunting, the main purpose of this testing was to prove that the new profile wasn’t detrimental to the vehicle performance or safety.
After 20,000 km of standard operation, the modified wheel showed a flange wear rate of half that of the original wheel. Additionally, the tread wear position moved further toward the center of the wheel and the rail, leading to better performance overall.
Simulations like these provide a very cost-effective way of testing and improving the wheel/rail interface. Variables can be quickly and easily fine-tuned, allowing for a broad and comprehensive range of test parameters that are often impossible to perform in the field.
The use of simulation to troubleshoot and optimize is also a cornerstone of the Enterprise Asset Management package under development at New York State Energy Research and Development Authority (NYSERDA) Public Transit Technology and Innovation Program.
Track infrastructure, and rail in particular, is one of the most expensive assets in a transit system. And much of the cost that goes into track infrastructure is preventive maintenance-related. But one common pain-point that many transit systems face is a lack of data to quantify the benefits of preventive maintenance for procurement and budgetary decision making, said Ankur Ashtekar, Vice President of Product Management at Sentient Science.
This data is also critical to maximizing the impact of maintenance strategies and demonstrating a quantitative state of good repair. NYSERDA is currently in the process of developing a software package designed to guide investment and maintenance priorities. “The goal is to use [the software] to stay ahead of wear and defects, maximize rail life, and protect the maintenance budget with hard evidence,” Ashtekar said.
The aim of an Enterprise Asset Management system is to provide a quick overview of the state of the entire network, and more detailed and granular data down to individual components. This can be combined with economic models at the network or component level, or anywhere in between, to identify maintenance cost-drivers. “By identifying high-cost assets or locations, you can more effectively prioritize your maintenance dollars,” Ashtekar said.
EAM systems are typically fed by the following data streams:
- Track geometry
- Rail profile
- Rail material
- Wear limits
- Traffic data (mgt, speed, direction)
- Wheel profile data
- Grinding plan and history
- Friction management
Each data channel is useful by itself, but bringing them together unlocks much more potential. Data like this can also be used to create detailed simulations that can forecast the evolution of rail wear and the effects of various grinding strategies on that wear, Ashtekar added. Simulations like these also help make the case for budget allocation when the most efficient strategy isn’t always intuitive. For example, more frequent grinding results in more rail wear overall, but also better preserves the profile shape and controls defect growth, meaning that despite the higher wear, rail life can be greatly extended by such a strategy, Ashtekar said.
All this data is also a key component of effective capital planning. Detailed information on each component feeds into the big-picture objectives of a State of Good Repair. Every maintenance strategy will affect the SGR decay curve differently, but having all the data correlated and readily available makes finding the optimal solution much simpler.
Applied Data
In addition to providing the basis for simulations and asset health assessment, accurate and detailed data is necessary to guide and optimize maintenance goals and strategies. In an absence of good data, systems often resort to a firefighting or heavily corrective methods of maintenance — moving from one critical issue to another, never getting ahead of the root problems.
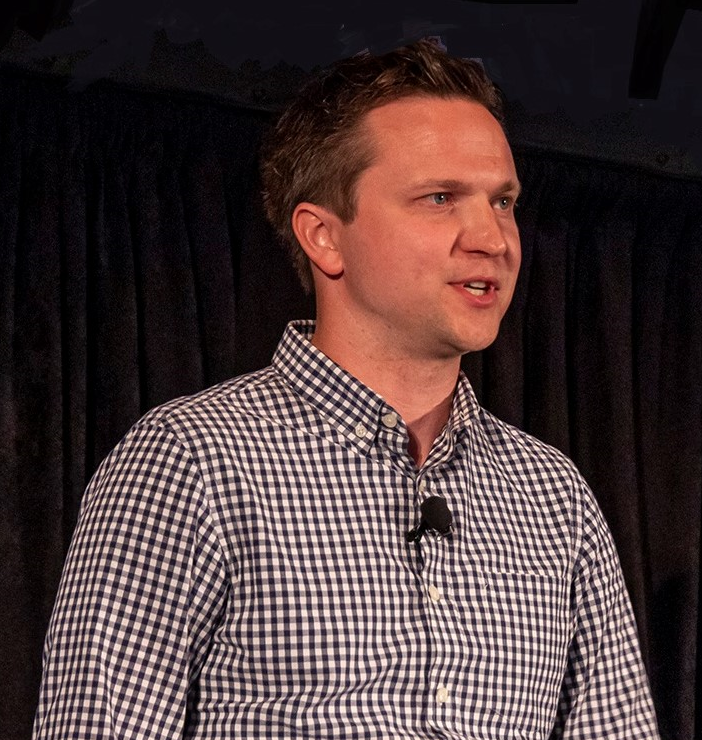
Corrugation is often one such critical issue. Vancouver’s SkyTrain, which is maintained and operated by British Columbia Rapid Transit Company (BCRTC) as part of TransLink, Metro Vancouver’s transportation authority, has historically dealt with a number of issues related to corrugation — particularly in the period between 2010 and 2015, “we became a bit of a household name in terms of corrugation,” said Peeter Vesik, BCRTC’s Asset Integration Project Manager. Many of these issues stemmed from greatly increased service levels related to the 2010 Olympics that were not ultimately aligned with maintenance practices at the time, he added. Faced with a growing corrugation problem and falling behind on corrective grinding, SkyTrain contracted the National Research Council of Canada (NRC) to assess the system and provide a roadmap for remediation. The general takeaway from that assessment was that unless changes were made to maintenance practices, significant re-railing would be required.
Following the assessment, SkyTtrain brought in Advanced Rail Management (now part of Global Rail Group) to implement an aggressive corrective grinding and reprofiling program, and to perform a wheel/rail profile compatibility analysis. In order to avoid repeating this large-scale corrective grinding at a later date, SkyTrain worked with ARM to develop a regular program of grinding with the ultimate goal of moving the system from a corrective-, to a transitional-, and finally to a preventive-grinding state.
The foundation of an effective grinding program is good data; this is especially true of preventive grinding, which must balance metal removal, profile compliance, defect removal, and surface condition to maximize rail life and optimize vehicle performance and ride comfort.
SkyTrain uses several datasets to inform its maintenance and grinding programs. These include track geometry data, ultrasonic defect detection, rail and wheel profile data, surface roughness, and noise and vibration data. “Maintenance is never the same from year to year because the conditions are always changing and always being monitored,” Vesik said. Additionally, the data ensures a more cost-effective grinding strategy — some track sections require grinding every three months, while others on the system are ground every two years; and there is no value in over- or under-grinding rail, he added.
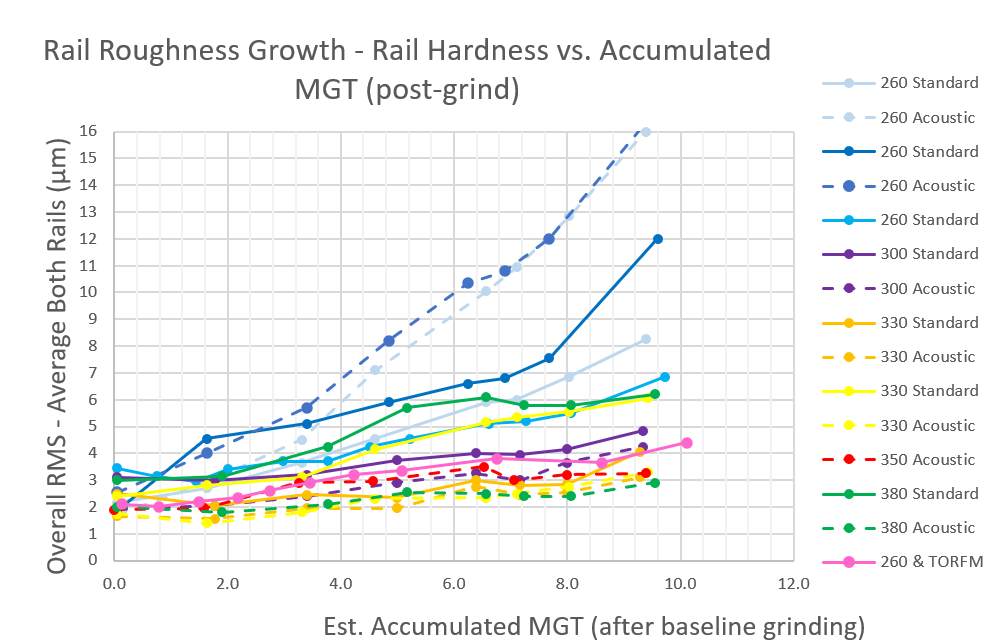
The surface finish or roughness that is left post-grind, in conjunction with rail hardness also has a significant effect on the rate at which corrugation returns. “We noticed that if you “polished” or acoustically-ground harder rail steels, it tended to stave off corrugation development for longer.” On the other hand, SkyTrain’s Expo Line, which has softer steels (in the 260 Brinell range), saw corrugation development very soon after grinding, regardless of the surface finish.
Another dataset that SkyTrain has found helpful to fold into their maintenance planning is data on grinding efficiency. Due in part to the system’s very short maintenance windows and complicated logistics, rail grinding presents a few unique challenges.

Looking forward, SkyTrain has two track expansions slated for the 2025 – 2030 period, as well as a fleet expansion in the same window. This means that in addition to more track miles to maintain, the existing track will see heavier usage. It’s important that a maintenance budget is commensurate with the demands of the system, and having good quantitative data is critical to making a financial case.
The key to developing an effective maintenance strategy, said Vesik, is robust data that enables constant input, feedback, and adjustment, in pursuit of a quantitative optimum.
Applied Data, 2
Sound Transit is another system in the process of building a database and asset management system to better guide it’s maintenance investment. “The goal is to codify specific performance metrics and areas of focus: safety, maintenance, environmental (noise) concerns, and passenger comfort,” said Shankar Rajaram, Engineering Manager at Sound Transit. Collecting data itself isn’t particularly difficult, but storing the data in a way that makes it easy to access, correlate, and quantify is more daunting, he added.
One of the chief concerns at Sound Transit is track and vehicle-born noise. The system has a number of stakeholder-related commitments that it must meet in terms of wayside noise, so these metrics have significant implications in terms of its finances and public approval.
Some of the wayside noise that Sound Transit contends with is attributable to the characteristics of its fleet. The system has two types of vehicles: series 1 and series 2 LRVs that have different manufacturers, but share a number of characteristics. The cars all have two trucks with solid axles, and a center truck with independently rotating wheels. The center truck wheels have historically been a source of consternation, due to their high wear rates, and their contribution to wayside noise, Rajaram said.
In 2019, Sound Transit contracted ARM and the NRC to conduct a study of wheel wear on its fleet. The results indicated that the powered wheels tend to hollow wear, while the independently rotating wheels tend to wear more heavily in the flange, and that they tend to wear more asymmetrically. This information helped guide Sound Transit’s wheel truing strategy. The study also noted that there was an opportunity to improve wheel truing technique and uniformity, inferring that a smoother wheel surface would produce less excess noise.
In addition to implementing the recommendations of the study, Sound Transit is currently in the process of building a hardware and software package for onboard noise measurement. This data will allow maintenance to quickly identify hot-spots or areas approaching a given threshold before they become severe enough that complaints are lodged, Rajaram said. To that end, this data will also be used to help guide the rail grinding program.
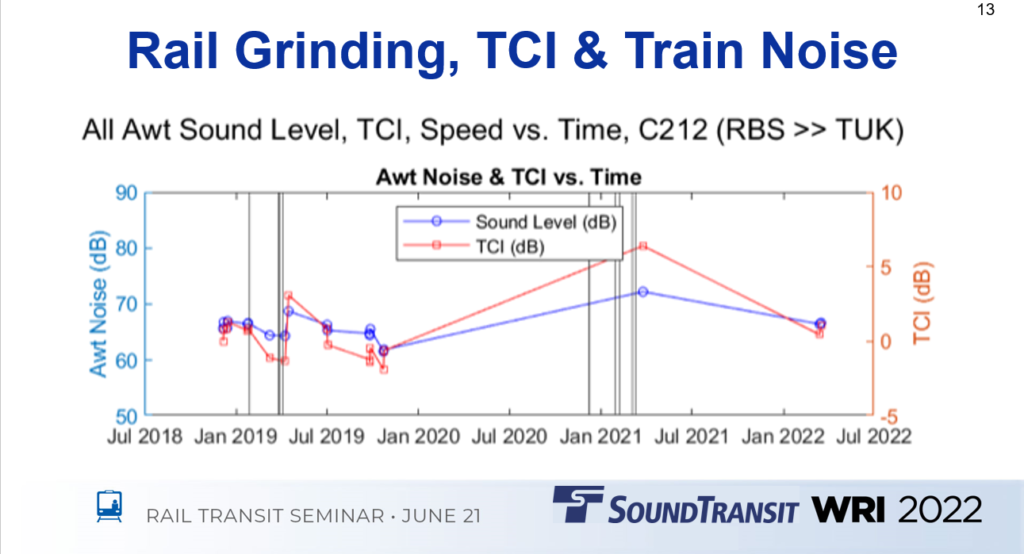
The noise data feeds into Sound Transit’s OnTrack database, which visualizes and correlates multiple data streams including decibel level, vehicle speed, rail wear, grinding history, track condition index (a derived metric based on relative noise levels), and X-octave noise intensity, Rajaram said.
The database is also used to quantify the effects of maintenance actions such as rail grinding. For example, an overview of the grinding history of a given section of track shows a corresponding drop in wayside decibel level and improvement in Track Condition Index. “These kinds of comparisons make it easy to see the effect of your maintenance dollars,” Rajaram said.
Sound transit is also using this data to investigate differences between the wheels on the two vehicle types in its fleet and their effect on wayside and vehicle noise. This includes determining the modal frequencies of the wheels, the acoustic radiation efficiency of the wheels and how it’s influenced by wheel diameter, as well as the influence of track type and condition on both wheel and rail acoustic radiation.
Sound Transit has already begun to leverage its broad, integrated database and realize the benefits. One example of this is a vibration analysis and mitigation project the system recently undertook. One of Sound Transit’s extensions passes beneath the University of Washington and is subject to stringent vibration constraints as a result. Within this section of track, there is a vibration-monitoring unit every 300 feet. When the new series 2 vehicles began to come into service in 2020, vibration test results indicated two peaks steadily nearing the exception level — one at 20hz and one at 63hz. Analysis indicated that 20hz peak was related to center-truck-wheel out-of-roundness. The 63hz peak was determined to be related to wheel/rail surface conditions.
By 2022, both the 20hz and 63hz peaks had grown and then exceeded the vibration threshold, prompting maintenance intervention. Retruing the center-truck independently rotating wheels effectively reduced the 20hz peak to below threshold level, but the cause of the 63hz peak proved more difficult to determine. By looking through the correlated data in their database, Sound Transit found a rail roughness peak in the 200mm frequency in the relevant section of track, and determined that a train moving at 30mph (the operating speed) over that track would generate high vibration in the 63hz range. The solution in this case, was to grind out the 200mm signature, leaving a finish that wouldn’t excite the 63hz resonance. “This kind of investigation isn’t possible without a well-integrated database and all the relevant data,” Rajaram said.
The State of Good Repair is a broad concept, generally considered a top-down overview of system health. It is that. But its accuracy is based on the granularity of the data. Throughout the transit industry, enterprise asset management systems are growing increasingly robust as more data channels are connected and correlated. Transit systems are using these databases to knock down silos and optimize maintenance and procurement strategies in new and inventive ways. Further adding value is the fact that much of this data already exists, has already been collected, but not integrated — its full potential untapped. As researchers and transit systems find new ways to leverage their data, further maintenance optimization, and thus budget optimization, is likely to follow.

This article is based on presentations made at the Wheel/Rail Interaction 2022 Rail Transit conference. See also part 1: The Tools of Remediation: Case Studies on Mitigating Common Concerns at the Wheel/Rail Interface.
Jeff Tuzik is Managing Editor of Interface Journal
Cover Photo by Jack Lindquist

