WRI 2017 – Transit: System Optimization and Better Asset Management
By Jeff Tuzik
Optimization, modernization and asset management are critical to the efficient running of a rail transit system. While each program is beneficial in its own right, the importance of asset management has taken on new significance with the recent Federal Transit Administration’s (FTA) rule making on the State of Good Repair (SGR). Much of the discussion at WRI 2017: Transit, in Montreal, Canada, was framed in terms of achieving and monitoring SGR. Transit systems that have already begun developing comprehensive asset management systems in order to monitor, trend, and optimize system performance will find themselves in a prime position to meet the SGR requirements, which can affect the level of federal funding that a property receives.
Asset management isn’t new to the industry, but it’s a topic that has become increasingly pertinent in recent years. Among the core aims of asset management is the development of a system capable of collecting, correlating, and displaying asset health data at granularities ranging from the whole system, down to the individual component. As it is currently written, one of the primary ways the FTA defines SGR in rail transit is the number of slow orders that are present on a given day, said Bill Doran, Principal Engineer at PreScience Engineers. A slow order, of course, can result from any number of issues, or combination of issues on the system — from a badly worn frog or track geometry defect, to a rail temperature alert. In simple terms, this means that transit systems will soon be compelled to precisely track these disparate measurements and components as well as how they interact with each other in order to influence system performance. In order to meet FTA regulations on SGR, Doran said, “There simply has to be a common framework for mapping different data.”
Effective October 2016, with full implementation to occur within two years, the date for compliance with the FTA SGR requirements is fast approaching. Among the provisions of the SGR rule is the establishment of a national Transit Asset Management System (TAMS) that will be fed by individual transit authorities. In order to do that, individual transit authorities must implement their own asset management systems that include the following elements:
- Performance measures for capital assets
- Performance targets for improving capital assets
- Reporting on the condition of assets (to the FTA)
- Analytical processes and decision support tools
While the requirements can be reduced to a few simple bullet points, the development, data collection, and data management challenges they represent are anything but simple. In order to tackle some of these challenges, Rail Surveyors and Engineers applied for and was awarded a grant from the FTA to develop a customizable and modular Inventory and Decision Support Program for Caltrain (known as CTAMS). Planning and development of the program took place between 2011 and 2013, and the software is now in use at Caltrain and Metrolink, in various capacities, Doran said.
The lessons-learned over the course of development and implementation of CTAMS highlight the challenges and opportunities that transit properties face as they develop or acquire their own asset management systems.
The core functions of CTAMS and other SGR-ready programs include asset inventory management, asset condition assessment, and work order management, Doran said. The programs have to be flexible enough to accommodate every asset, as well as the sub-assets and components that make up the asset. A bridge asset, for example, is at the top of a hierarchy of sub-assets like rail and ties, and components like ballast, ballast retainer, waterproof membrane, deck drain, and many others — clear indication that the health of an asset is a complex measurement based on the health and interaction of many other assets.
Track is a particularly complex asset to assess given the complexity of wheel/rail interaction and the diversity of wear and damage mechanisms that affect it. In order to apply the kind of 1-to-5 asset health rating required by the FTA, a tremendous amount of varied data must be collected and analyzed. There is also variability in how transit properties segment their track for the purpose of condition monitoring. One property may asses track in uniform tenth-of-a-mile segments, while another may look at tangent, spiral, and curve segments regardless of length, Doran said. In addition, different organizations use different data channels for their in-house condition monitoring. For example, gauge-face angle may be a driving metric for one organization, but a relatively minor metric for another.
A benefit of having data on so many components and their interaction is the ability to make and justify decisions based on readily-accessible quantitative data. “Too many design choices made today are based on tradition instead of science,” said Bill Moorhead, Principal of TRAMMCO, LLC. Correlated, contextual data enables decisions ranging from which type of frog to use in a specific cross-over, to whether or not a curve requires restraining rail to be situationally optimized, rather than being based on standard-practice, he added.
All these factors necessitate an asset management system that is not only flexible, but capable of sophisticated and nuanced data collation. In order to make that happen, “it’s important that supervisors and engineers work very closely with the software developer,” Bill Doran said.
A Wheel/Rail Laboratory
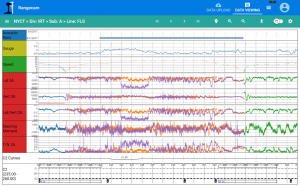
An application under development by Holland LP for the NYCTA project shows multiple disparate data channels (including acoustic, rail wear, track geometry and truck performance data) displayed in relation to each other.
The ongoing wheel/rail interaction study sponsored by the Federal Transit Administration on the New York City Transit (NYCT) #7 Flushing Line is an example of how many disparate sources of data can be combined and correlated to provide data on high-level system health. And while the NYCT project is not nominally an SGR or asset management program, this broad and deep study of wheel/rail interaction has clear relevance to the subject.
Since the project was introduced by Tony Cabrea, Director of Track Engineering at NYCT, at WRI 2016, the instrumentation phase of the project has been completed and data has begun to be collected. A combination of wayside and onboard measurement devices provides a constant stream of data during daily revenue service. The measurements include:

Tony Cabrera, Director of Track Engineering at the New York City Transit Authority.
- Wheel and rail profile
- Track geometry
- Truck performance and angle of attack
- Wheel/rail contact forces collected by an Instrument Wheelset to characterize steering, wheel slip, friction, etc.)
- Energy consumption
- Sound generation
- Equivalent conicity
Each of these data sets is then aligned using GPS and RFID car tags and can be displayed in various formats that reveal the relationships between them. “We can correlate sound data with truck performance and rail profile data [for example] to pinpoint systemic issues,” said Eric Magel, Principal Engineer at the National Research Council of Canada (NRC), which is responsible for analyzing the project data. Another benefit of putting so much disparate data together is that it can be analyzed to determine what changes to the system, whether remedial or optimal, will have the biggest impact on overall performance. “After getting a system baseline, the first thing we’ll be able to do is identify the low-hanging fruit,” Magel said.
The data generated by the project in conjunction with the correlation and analysis is expected to provide an unprecedented level of holistic information; “It’s the quintessential wheel/rail analytics program,” Tony Cabrera said.
Noise as Performance Measurement
 Noise generated at the wheel/rail interface can be a good barometer of overall wheel/rail performance, and is one of the most noticeable indicators when something goes wrong. The data collected by onboard microphones (like those used in the NYCT project) is even more useful when it’s compared and correlated to additional datasets. These metrics together can be used to assess overall track health and play an important role in monitoring SGR, said Hugh Saurenman, President of ATS Consulting.
The San Francisco Bay Area Rapid Transit (BART) has used ATS Consulting’s CorrTracker application since 2012 to view acoustic data (noise) throughout the system in order to prioritize and monitor the effectiveness of its rail grinding program, Saurenman said. In 2016, ATS (working in part with Seattle’s Sound Transit) expanded the CorrTracker application to display contextual rail measurement data in conjunction with noise data to better understand and pinpoint problem areas. The program can now display noise data, in terms of frequency and decibel levels, along with corresponding track section metrics, such as the rail type, wear measurements and degree of curvature. The end goal, Saurenman said, is to use the collated data package as a quantitative performance measure.
The program has already been helpful in quantifying some of the benefits of the new wheel profile that BART has begun to implement across its system as part of a major program to phase out the historically poorly-performing cylindrical wheels and replace them with more typical tapered wheels. Early results have shown that cars equipped with the new BT-3 conical wheel profile are on average 10 dBA quieter on sharp (greater than 5-degree) curves than the cylindrical wheels, Saurenman said.
While noise reduction is a critical factor in its own right, it also directly indicates an improvement to the wheel/rail contact conditions, and, thus, to the entire system itself. The importance of addressing issues at the wheel/rail interface from a “systems” standpoint is not new to the transit industry, and it certainly predates the recent push for holistic asset management brought on by the FTA’s SGR directives.
The Wheel / Rail System
The story of the LA Metro is one that is often referenced at WRI conferences because it encapsulates the importance of holistic management of both wheel and rail conditions. The LA Metro’s wheel and rail issues came to a head back in 1994, prompting an investigation and aggressive remedial action.

Wyman Jones, Director of Rail Operations and Strategic Planning of Metro Rail Operations for the Los Angeles County Metropolitan Transit Authority.
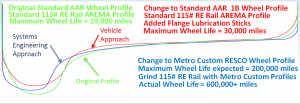
At the time, wheelsets typically lasted only 19,000 miles before being scrapped. Rail in relatively low-degree curves had to be replaced after 2 years. System-wide rail crossover speeds were reduced to maximum 10 mph due to the high risk of wheel climb derailment, said Wyman Jones, Director of Rail Operations and Strategic Planning of Metro Rail Operations for the Los Angeles County Metropolitan Transit Authority. The incredibly high rate of wear on the wheels pointed to the wheel as the culprit. As a result, the first remedial steps that La Metro took, on the advice of outside consultation, were focused on that side of the equation. Throughout the fleet, wheels were reprofiled to the AAR-1B design. Truck-mounted solid-stick wheel flange lubricators were installed on every wheel, and modified truck side bearing plates were installed in order to improve wheelset angle of attack and steering.
The effect of these changes was immediate and dramatic. Wheel life improved 150 percent. But the average wheel life of 30,000 miles was still well below expectation, and rail wear-related issues were largely unaffected. “We weren’t dealing with just a wheel or a rail problem, we clearly had a system problem,” Jones said. So, the LA Metro went deeper and in conjunction with Advanced Rail Management Corporation (ARM) and Resco Engineering performed a system-wide analysis.
The analysis concluded that changes to the rail profile and additional changes to the wheel profile were necessary to improve performance. The modified wheel profile (the so-called RESCO wheel) featured a number of modifications:
- A tapered profile from throat to the mid-point of the tread in order to maximize rolling radius difference for better performance in tight curves.
- A thin flange to allow for the more significant radius differential. (see image on ppt slide to use as illustration)
- A high-angle straight flange to reduce wheel climb risk.
The RESCO wheel was not designed in a vacuum, however. It was designed in concert with custom rail grinding profiles provided by ARM. The combined wheel and rail profiles were designed to:
- Reduce flange contact
- Spread wear uniformly across the wheel tread to avoid tread hollowing
- Enhance rolling radius difference through curves
- Improve the transition through special track work
After implementing the matched wheel and rail profiles, LA Metro saw wheel life increase by over 1,000-percent. Actual wheel life rose to 600,000-plus miles. Rail life was also significantly increased; no major rail replacement has been necessary in over 16 years, Jones said. These profiles are still maintained by LA Metro today; improvements that continue to pay dividends. Wyman Jones added that many transit properties have contacted the MTA over the years when their own wheel profile changes didn’t result in similarly dramatic wheel-life improvements. The answer, according to Jones, is that wheels are only half of the equation; wheels and rail are intimately linked. “The most benefit comes from a fully-integrated system-design approach.”
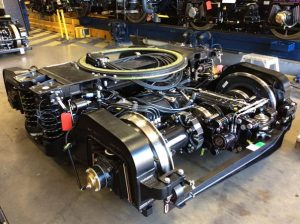
Optimizing truck performance based on the real-world conditions it is likely to encounter is an important part of overall system optimization. Image courtesy of Bryce Dudgeon.
System optimization also includes vehicle design. Many of the same conditions that must be assessed in the optimization of wheel and rail profile design apply to vehicle design as well. Track geometry data, design wheel profile, worn wheel profile, maintenance limits, details of special trackwork, and a number of other parameters all inform car design characteristics, such as suspension stiffness, yaw stiffness, and truck-mounted lubrication. Data provided by a transit agency procuring a new car is used by vehicle suppliers to model car behavior over the conditions it will actually encounter. These simulations are used to assess L/V ratios, curving performance, truck stability, hunting propensity and ride quality. “The more data we have the, the better we can optimize a car for its operating environment,” said Bryce Dudgeon, Senior Mechanical Engineering Manager at Siemens Rail Systems.
For instances in which existing track geometry data is not available, Siemens developed a non-contact mobile track measurement device that can be mounted to existing vehicles to measure gauge, crosslevel alignment and track profile deviations.
The introduction of a new fleet to an existing line brings additional engineering and operational challenges, said Raffaele Trentadue, the head of rail cars and shops in subway operations for the Toronto Transit Commission. Among the areas that must be considered are the operational impact of the new versus the existing vehicles, the vehicle/infrastructure interface and the impact that the new vehicle design will have on vehicle (and potentially, track) maintenance, he said.
Ultimately, no matter how well-optimized the rail, wheels, and vehicle are, a system in operation is a system in constant degradation. But the types of changes that the LA Metro implemented in order to improve its wheel and rail life have ongoing value because along with the changes to wheels and rail, there were changes made to the ongoing proactive maintenance of those profiles.

Matt Doyle, Director of Railway Infrastructure at SkyTrain.
The experience of the Vancouver, BC SkyTrain, on the other hand, is an example of what can happen when a wheel/rail optimization program doesn’t include a systemic change to maintenance practices. Early in its operation, SkyTrain developed a number of wheel/rail interface-related issues including wheel squeal, truck hunting, high rates of wheel hollowing and flange wear and severe corrugations. SkyTrain worked with the NRC and Resco Engineering to optimize the system. This involved implementing new wheel and rail profiles and the use of improved friction management techniques. The changes were effective, but a lasting preventive maintenance regime designed to preserve the optimal condition was not put into practice, said Matt Doyle, a SkyTrain veteran recently named of Director of Railway Infrastructure.
As a result, over time, maintenance reverted to a reactive or “fire-fighting” mentality, in which SkyTrain’s resources were spent chasing and remedying critical corrugation or noise-exception locations, Doyle said. Part of this is due to the fact that SkyTrain, like many transit properties, saw a number of retirements that left an experience gap — and because the optimal maintenance practices were not adequately systematized, a lot of hard-won knowledge was effectively lost, he said.
SkyTrain is now in the process of re-optimization. This includes an expanded and better-optimized implementation of friction management, aggressive rail grinding to return to the design-profile, implementation of a preventive rail grinding cycle, and a system analysis to determine the appropriateness of the current wheel / rail profile combination. This re-optimization process is in relatively early-days, Doyle noted, but SkyTrain is committed to ensuring that the optimal state endures, this time around.
It’s clear that the industry-wide discussion on the State of Good Repair has reframed and invigorated interest in a holistic and system-oriented approach to rail transit operations. Monitoring asset performance at various levels of granularity is a daunting task, but it paves the way for deep system analysis and performance-based optimization. The up-front and development costs of applications that can display disparate but correlated data look to be a small investment with substantial returns, provided the data is acted upon. As transit properties’ asset management tools become increasingly robust over the next few years, we at Interface Journal look forward to seeing how that data is used to inform the decision-making process at all levels of maintenance and operations.![]()
Jeff Tuzik is Managing Editor at Interface Journal.
All photos courtesy of Jack Lindquist.


