Using Digital Twin Simulations of Automated In-Train & Vehicle/Track Dynamics to Reduce Derailment Risks
by Jeff Tuzik
“Engineers predict things,” said Cory Hogan, Director of Vehicle Dynamics Studies at Ensco Rail Inc. As computing power and modelling have become more sophisticated, engineers have increasingly used digital-twins to model vehicle, track, and component behavior with incredible fidelity. Like engineers, digital twins can be great predictors. A digital twin is a virtual model of a component, process, or system that is designed to reflect its real-world counterpart (a physical twin) as accurately as possible. One of the most common ways digital twin simulations are used is to predict potential problems or failure modes in a safe environment, and before the issue appears in the physical twin. “The predictive aspect of a digital twin is my focus: I don’t want to figure out how a derailment happened after the fact, I want to predict and avoid it,” Hogan told delegates at the 2024 Wheel/Rail Interaction conference.
A digital twin that faithfully represents its physical twin also allows for testing that may be impossible or unfeasible in-situ, such as modelling the effect of increased speed on vehicle dynamics and derailment potential, for example.
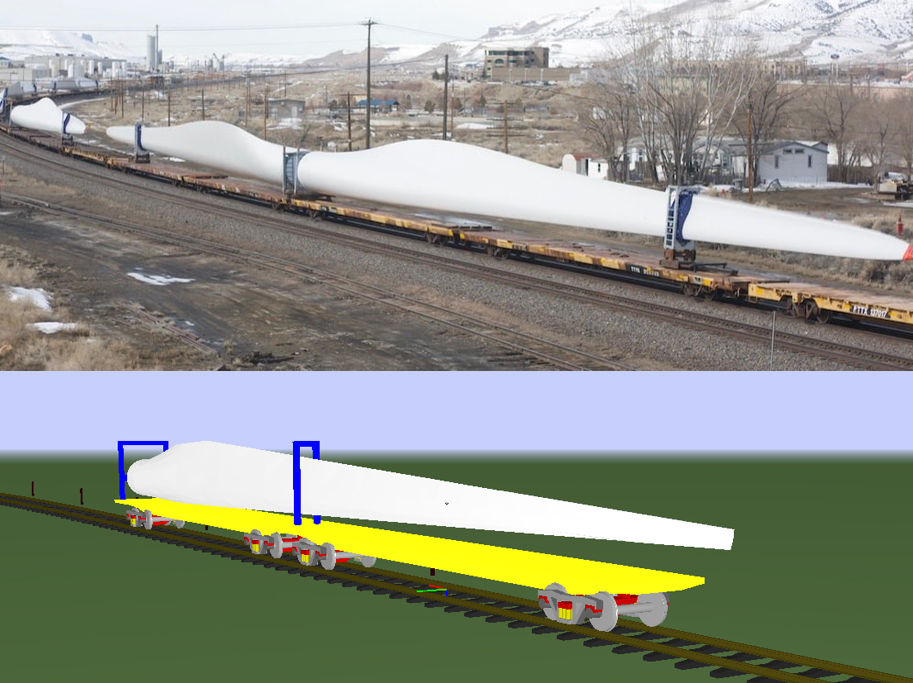
In another example of how digital twins are used, Hogan and Ensco recently undertook a project that involved simulating vehicle and carbody dynamics of a train transporting very large wind turbine blades. These components are particularly sensitive to certain vibrational frequencies, Hogan said, so the team modeled several different support systems to find a configuration that would effectively isolate the component from carbody and wheel/rail vibration (figure 1).
Regardless of the specific end-goal, an accurate digital twin requires accurate data on the physical twin.
“One thing I’ve found in derailment investigation is that often the data necessary to predict a derailment was available before the derailment happened,” Hogan said. This is often the result of underdeveloped data infrastructure; just as there are departmental silos that can prevent communication between teams, there are data silos that can prevent interaction between data streams. Much of the focus in this regard is on streamlining and automating collection and correlation of data streams. “It is because we knock down the silos that we’re able to be predictive,” Hogan said.
Part of the challenge is that larger and more complex digital twins require more, and more frequent data collection. The digital twin for a single rail car operating over a small section of track, for example, is simple compared to the digital twin of an entire rail network; As a system, a rail network changes constantly, Hogan said. As a result, the digital twin and physical twin may differ significantly a short time after data collection. This means that frequent, repeated measurements are necessary to ensure the digital and physical twins remain in sync. So, the creation of an accurate and useful digital twin for a network requires the combination of frequent geometry measurements and automated data transfer, processing, and reporting, he said.
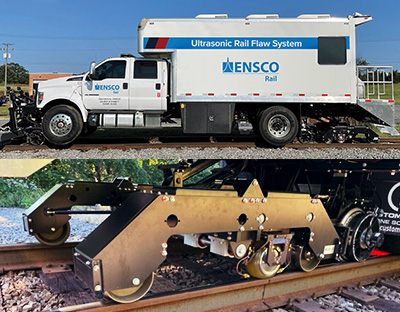
From a practical standpoint, this type of digital twin is built by collecting geometry data from autonomous track geometry measurement systems (ATGMS) operating throughout the network (figure 2). These vehicles can be integrated into any freight consist just like a standard box car and have their own redundant power supply. The ATGMS are also ballasted so that their weight and performance more accurately reflect that of a loaded boxcar.
The data generated by ATGMS is automatically transferred via cellular signal to a cloud-based reservoir where it is automatically processed and prepared for simulation by modified VAMPIRE (Vehicle Analysis Modeling Package In the Railroad Environment) software. VAMPIRE is a multi-body dynamics modeling package often used to model forces imparted from track to vehicle, forces transmitted into vehicle components, and derailment risk. VAMPIRE is widely used in the railroad industry and by researchers and academics; its origins are in the late 1980s with Delta Rail, AEA Technology and British Rail Research. “Getting VAMPIRE to work in a cloud environment is something we’ve been working on since 2008, and there’s still work to be done,” Hogan said, “so none of this is an easy process.” The benefit is that simulations are supported by cloud-based parallel processing, so they are completed very quickly. Automated reports from these simulations are then made accessible to the relevant personnel.
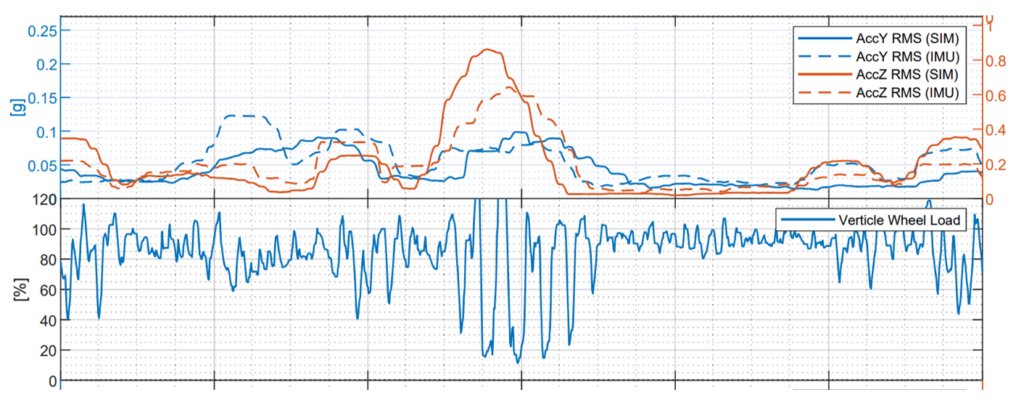
As is the case with any simulation, the veracity of the output must be validated, which is done by comparing simulated output data with measured data. This was done by running an ATGMS equipped with several accelerometers and an inertial measurement unit over a section of track, and then modeling ATGMS vehicle dynamics for the same track section. Figure 3 shows the close agreement between simulation and measurement. “If you can accurately model mass and inertia, stiffness, damping, and excitation source, you’ve got a useful model,” Hogan said. “This validation test gives us confidence that we’re accurately modeling accelerations and wheel/rail excitation.”
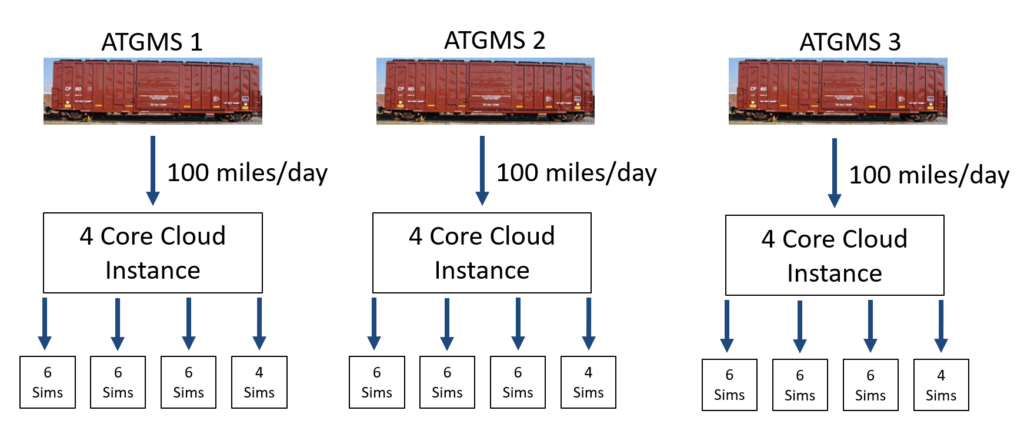
Following the development and validation of the ATGMS / cloud-based VAMPIRE system, Ensco first deployed the system on the Canadian Pacific Kansas City Limited (CPKC) network. At the time of deployment, the CPKC network was roughly 14,000 track miles. With three ATGMS units each averaging 100 miles of track measurement per day, this gave Ensco 300 miles of track geometry a day to process and simulate. CPKC requested simulations for 11 vehicle models moving both directions (up- and down-milepost) at the maximum posted speed. This added up to 22 total simulations per mile of track. VAMPIRE can run a single simulation of a mile of track (including filtering, simulation, and data export) in roughly 1 minute. This all adds up to 6,600 minutes of processing per day — an impossible task without parallel processing.
To keep pace with all the data, Ensco created a 4-core VAMPIRE cloud instance for each ATGMS (figure 4). Under this processing regime, the required processing time went from 6,600 minutes to 600 minutes (per day). “At this rate we were able to not just keep up, but to stay ahead of the incoming data,” Hogan said.
One of the ways Ensco sought to further leverage the data they were collecting was to investigate and simulate the effect of coupler angles and forces, as well as in-train longitudinal (buff and draft) forces on L/V derailment risk thresholds. “Longitudinal forces and coupler angles have a big effect on L/Vs at the wheel/rail interface, and we wanted to pull that data into the automated system we built,” he said.
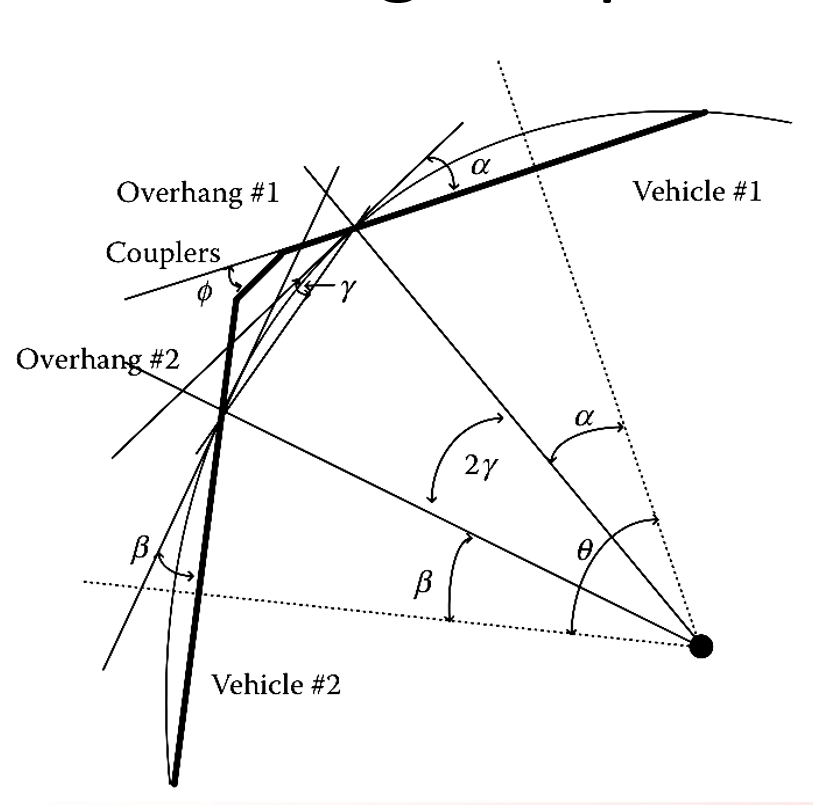
Ensco partnered with Union Pacific and PS Technology to develop a proof-of-concept for adding this data to their existing VAMPIRE software package. Coupler angles for a given route were calculated based on consist makeup and car type, and existing curvature data from the track geometry system (figure 5), and then correlated to ATGMS in the cloud.
The proof-of-concept simulation was based on a 121-car mixed-load consist with head-end and rear-end power. Ensco focused their analysis specifically on a 90-foot bi-level autorack, 23rd from the head end. This car was bracketed by two shorter cars (a 68-foot reefer and a 50-foot boxcar) — an arrangement known to generate severe coupler angles and high coupler forces, Hogan said.
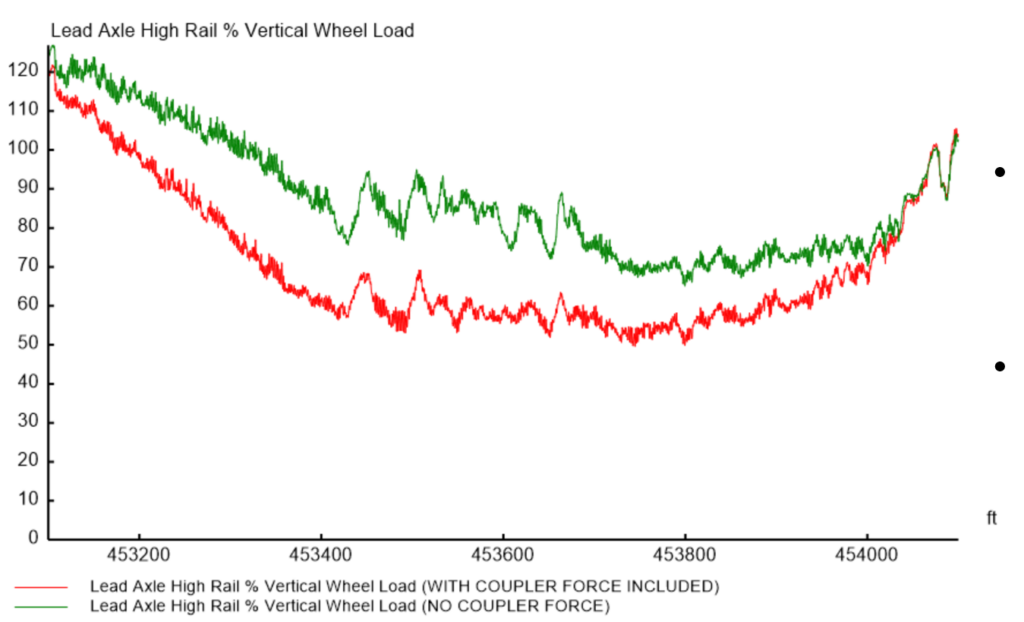
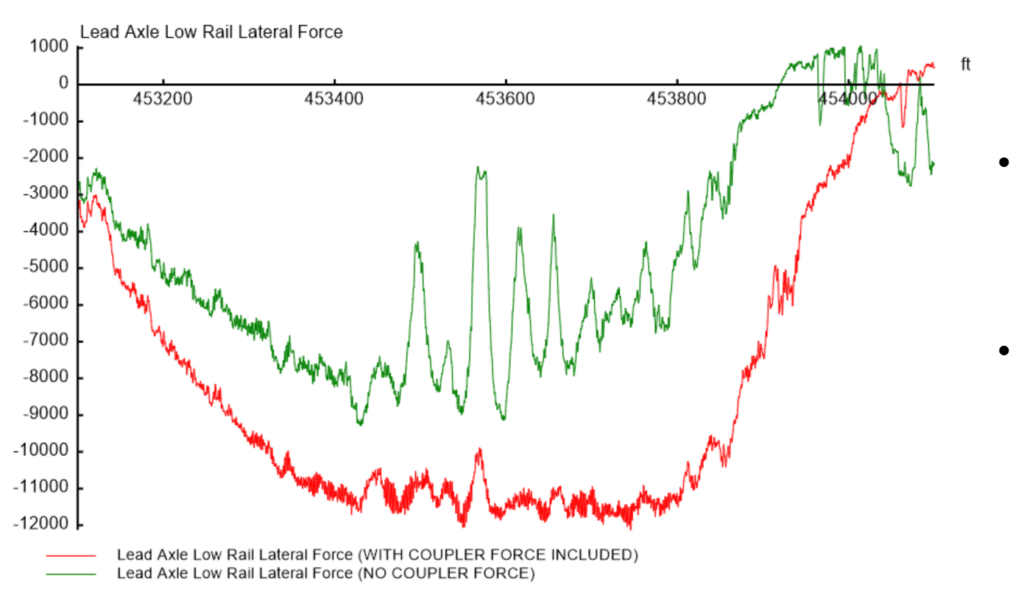
The simulation did indeed predict high coupler forces at several locations on the simulated track. “We were particularly interested in how the integration of simulated coupler forces would affect vehicle dynamics,” he said. Figure 6 shows the simulated vertical loads for the lead axle of the car of interest in green, and the same car with the addition of simulated coupler forces in red. At this location, the simulated train is traveling at 11 mph through a 6-degree right-hand curve with 5 inches of superelevation, under 145 kips of draft. Both the red and green graphs predict vertical unloading of the lead axle on the high rail as expected for a vehicle traveling at underbalance through the curve, he said. However, the red graph, which takes into account coupler forces, indicates a much more significant unloading. As shown in figure 7, a similar effect can be seen on the low rail as well; dynamic lateral loading peaks 30% higher with the inclusion of coupler forces than without.
This proof-of-concept highlights the value of integrating multiple data streams to create a more robust and flexible simulation. And although the project only simulated a single car, the ease of incorporating parallel processing to cloud-based solutions means that processing power doesn’t represent a major bottleneck, Hogan said. In fact, part of what makes the cloud VAMPIRE system so adaptable is that simulations considering many different types of data including train handling, speed, topography, and power distribution can be integrated with VAMPIRE data without disrupting or interfering with ongoing ATGMS-based simulations.
Hogan sees many potential improvements and expansions of the cloud VAMPIRE/in-train force modeling package. One potential feature is a vehicle dynamics risk-lookup table based on VAMPIRE simulation data that automatically runs against other simulations in parallel, he said. For example, a coupler-force simulation of a single car could be applied to system-wide data relating to multiple speeds, conditions, and locations to determine whether any combination of factors could present an elevated derailment risk.
Future plans for the project also include the integration of rail and wheel profile measurements so simulations can model wheel/rail interaction with high granular accuracy and output data points like base-over-height (B/H) ratios, conicity plots, and critical L/V ratios for individual wheel/rail combinations. Wheel and rail profile data will also improve the ability to model vehicle/track interactions that are heavily influenced by wheel/rail interaction, such as hunting and steering characteristics. “At this point we’re focused on completing the picture — of building a more complete digital twin,” Hogan said.

Jeff Tuzik is Managing Editor of Interface Journal.
This article is based on a presentation made at the 2024 Wheel/Rail Interaction Heavy Haul Conference.

