Modelling Success and Predicting Failure at the Wheel/Rail Interface
WRI 2016, Heavy Haul Part 2
By Jeff Tuzik
The worst time to explore the complexities of contact mechanics, lubrication, metallurgies, carbody behavior or other aspects of wheel/rail interaction is at a derailment site. But it’s often the most instructive. As George Fowler, Senior Investigator at the Transportation Safety Board of Canada, pointed out at the 2016 Wheel/Rail Interaction Conference, those who conduct derailment investigations are in a unique position to get an intimate view of what happens when wheel/rail systems interact poorly, and the catastrophic results. A 2013 derailment in Ontario provided one such example. The investigation, which was conducted by the Transportation Safety Board of Canada (TSB) found evidence of a number of wheel/rail factors that contributed to the derailment. “None of these [factors] alone would cause derailment; all together, they did,” Fowler said.

In this instance, the train was traveling at 37 mph when the derailment was initiated near the 22nd car in the consist. Train brakes and locomotive brakes were both activated. The point of derailment was between reversing 4 degree and 4.9 degree curves. Over the course of the investigation, a number of pertinent factors were identified.
- The high rail was very near the railroad’s wear limit for its class, Fowler said.
- For the train speed of 37 mph, the curve was 3.5 inches under-elevated. “Superelevation is a big concern, and not one people always take as seriously as they should,” Fowler said.
- Track gauge measurements in the 4-degree curve, according to a recent geometry inspection, found 175 feet of wide gauge over 0.5 inches.
Prior to the derailment, track maintenance crews re-gauged the rail. But track maintenance tasks can inadvertently negatively affect wheel/rail contact, Fowler said. Re-gauging tends to move the contact band toward the field side of the high rail and toward gauge side of the low rail. This combination often leads to poor curving performance and heightened rail rollover risk. “Ideally, a rail grinding program would address these issues after re-gauging or cant restoration, but that’s rarely feasible in practice,” Fowler added.
The investigation ultimately determined that the derailment was likely initiated by the high rail of the 4-degree curve rolling out. This caused the trailing L4 wheel of the 22nd car to drop down and ride the web and base of the rail, thus spreading the high rail even further. The under-elevation of the curve contributed high lateral forces and dynamic wide gauge. And because contact had been moved toward the field side of the high rail (due to the recent re-gauging), the base/height ratio for the rail rollover threshold was such that significant L/V forces were not required to initiate rollover. Any one of these factors alone seems relatively innocuous. But from a system standpoint, each factor exacerbates the others. And in this case, it was enough to push the system into catastrophic failure.
A rail grinding application to reprofile the rail following gauge maintenance may have been enough to prevent the derailment. But rail grinding programs don’t typically have the flexibility to perform specific grind plans outside of a scheduled grind cycle or major corrective grind.
A New Grinding Strategy

CSX Transportation is currently engaged in a project that aims to address some of the flexibility issues, and to improve grinding efficiency overall, particularly in the area of specialty grinding. Specialty assets like switches and crossings typically get less attention from rail grinding programs because these programs focus on larger assets like curves and tangents. Specialty assets are also rarely included in preventive grinding regimes, which puts a greater burden on specialty grinders when they do get track time, said Kevin Burton, Director of Specialty Grinding and Fleet Operations at Loram Maintenance of Way. In order to address these disparities, CSX posed the question: could a similar preventive strategy be applied to specialty grinding as well? “Why not put the two [production and specialty grinding] machines together and utilize the same track access window,” he said.
On CSX, like on most railways, the two programs typically operate independently of each other. The production grinder is preceded by an inspection vehicle that collects data, calculates patterns and generates a grind plan. Specialty grinding on the other hand is a manual process, said Daniel Hampton, Manager of Contract Services at CSX. Hand tools, visual inspections, and personnel on the track make this comparatively slow and laborious. In order for a joint grinding program (that is, a combined production/specialty grinding program) to work, the specialty grinder has to be able to keep up with the production grinder that is moving at a steady 12 mph, Hampton said. But if the program worked, it would be a major benefit to the railroad, resulting fewer resources spent, less disruption to operations, and more specialty grinding overall.
“Our number one goal was to make sure that the specialty grinder didn’t slow down the production grinder,” Hampton said. Working with Loram, CSX developed a prioritization method for determining which assets to skip in case the production grinder began to outpace the specialty grinder. If an asset is skipped, it rises to top priority during the next scheduled grinding cycle. CSX and Loram also determined that the optimal system was for sections larger than 250 feet to be handled by the production grinder, and sections less than 250 feet by the specialty grinder.
CSX put the new joint grinding into limited practice as a pilot program, and compared results to previous years’ rail grinding data. The results were very promising. The pilot program saw a 40% increase in grind speed, increased pass-miles-per-day by 26% and a 100% increase in units per operating hours. The new approach allowed CSX to eliminate 1.5 full-time-equivalent employees, and to use only one water truck for fire suppression. As a result of these successes, the pilot program was expanded to the entire system. “One of the biggest benefits is the ability to use the same grinding window for everything,” Hampton said. One of the less tangible benefits of working the production and specialty grinders in tandem is the ability to blend the grind finish on smaller track sections to match the production-ground rail, allowing for a more uniform rail, he added.
CSX is continuing to develop and refine its joint-grinding program. The next step is to develop customized complimentary grind plans for the production and specialty grinders. Typically, grind plans are designed as an averaged metal removal in one-mile sections, Hampton said. But with the addition of the specialty grinder, grind plans can have more flexibility to accommodate variations within those one mile sections that may require additional attention or an alternate grind pattern. CSX also plans to explore and develop technologies for measuring pre- and post-grind surface condition to further optimize the program.
The success of the CSX program has generated significant interest throughout the industry, and it may come to serve as a template for other railroads looking to optimize their own rail grinding programs, said Bob Tuzik, Rangecam Business Manager at Holland LP and moderator of the 2016 Wheel/Rail Interaction conference.
Modelling and Simulation
Many of the technologies that are changing and improving the way railroads manage everything from operations to maintenance are purely software based. As the quality and veracity of simulations have increased over the years, various studies and projects too impractical or labor intensive for field work can be conducted relatively easily and accurately on a computer.
A good example of this is recent work done by MRS Logistica S.A., to model harmonic excitation in vehicle/track interaction. The aim of the study was to explore how operational changes (such as speed limits and slow orders) affect carbody dynamics.
In modelling harmonic excitation for the study, co-authors Raphael Marotta, Track Specialist at MRS and Lucas Valente, Rolling Stock Specialist at MRS, focused on the “lower sway” mode of carbody motion, which is a combination of rolling and lateral oscillation. This type of oscillation is typically initiated by a crosslevel irregularity, Marotta said.
The next step of the project was the development of a model to determine the likelihood of significant resonance issues based on track geometry measurement data and vehicle simulation data. The parameters used in the vehicle modelling side of the equation included: mass and torque mass, wheelset type, stiffness element, load suspension, friction wedge damping, and non-linear stiffness (to model sidebearings). The track geometry side of the equation included any known geometry defects, as well as loaded and unloaded gauge (lateral stiffness), and track modulus, Marotta said.
Using all these parameters, the MRS team calculated a test case for a derailment at a track section that had previously experienced a derailment. The simulation found that at 30 km/h, harmonic excitation caused a maximum wheel unloading of 30%. At 50 km/h, the resonance was such that wheel unloading reached 100%, meaning the wheel was effectively lifting off the track. At speeds higher than 50 km/h, maximum wheel unloading dropped back to acceptable levels. “There are certain speeds at which harmonic excitation is problematic for a car; that risk can be mitigated by either increasing or decreasing speed,” Lucas Valente said.
As a result of these simulations, MRS was able to pinpoint problematic areas throughout their system. They’ve also been able to safely increase speeds throughout the system in various locations and for certain consist types due to simulation data that indicated the new speed limits were not within the range of speeds that initiate harmonic excitation, Valente said.
Canadian National has also recently leveraged the results of a modelling project into a practical application on their system. After experiencing a number of failures (and a number of failure modes) on frogs at low MGTs, CN began a project to model wheel behavior at the frog, and to design a frog better optimized for their wheel population.
The methodology involved moving a model wheel across a model frog, and taking lateral and vertical positioning measurements at one-inch intervals. Measurements were taken in this way for an AREMA standard frog and a Conformal frog. The wheels used in the modelling were AAR1B: unworn, 1.0mm worn, 2.1mm worn, 3.1mm worn, and 3.8mm worn. CN then used the measurements to calculate vertical accelerations and wheel tracking position through the frog.
One of the key findings from the modelling work was that conformal frogs consistently generated higher vertical accelerations on worn wheels, and that the peak acceleration values in the models correlated to frog damage observed in the field. Using the information and methodology of the study, CN designed and modelled a new low-impact frog. The frog design that performed best features:
- A conventional point, with the AREMA-recommended point slope
- 1/8 inch wheel risers
- An AREMA type flat-top profile
- A 5/8-inch gauge-corner radius
- A vertical guard flangeway
CN had 10 of the new frogs produced by various manufacturers (to control for possible manufacturer variation) and installed them for field testing. Over several months, CN will evaluate their performance and expand to revenue testing should the new frogs prove effective at mitigating premature wear and damage.
Predicting Rail Temperature
In another example of applying software to fix a hardware issue, Ensco, Inc. explored a new and novel method for predicting rail temperature. Longitudinal stress in continuously welded rail (CWR) has to be carefully managed in order to prevent cold weather breaks and track buckles (or sun kinks). Railroads tend to set their rail neutral temperature to err on the side of avoiding track buckles, a practice that can increase the likelihood of cold weather rail breaks. The goal, of course, is to avoid both.

Rail temperature is typically estimated, rather than measured. This is predicted by adding a temperature offset, typically 30 degrees, to the ambient air temperature, said Matt Dick, Director of Business Development at Ensco, Inc. “This doesn’t work all the time, and there’s a broad distribution of actual offset temperatures,” he added.
In order to more accurately predict rail temperature, Ensco leveraged data from their aerospace division’s weather prediction program. By combining weather parameters like air temperature, solar radiation, solar angle, wind speed, and sky temperature, and combining them with known properties of the rail itself, Ensco developed a rail temperature prediction model. The predicted temperature data is sectioned into a 9-by-9 kilometer grid for the entire United States, where each section of the grid can be matched to a known rail route and milepost. “It’s a virtual rail temperature model in roughly 6-mile chunks,” Dick said.
Ensco worked with CSX and Amtrak to validate and tune their model based on those railroads’ wayside rail temperature monitoring systems. The results showed the prediction model to be on average within 5 degrees of actual rail temperature. Ensco also explored the theoretical feasibility of using the data for a slow order alert system. The findings showed the predictive model to be more accurate in terms of true positives and false positives, than the standard fixed temperature offset method, Dick said. The study also found an overall 33% reduction in slow order mile hours by using the predictive model. “The predictive model can allow you to pinpoint slow orders better, resulting in fewer, and shorter slow orders,” he said.
Amtrak currently uses the Ensco model in conjunction with their own wayside temperature sensors. The model is used to generate reports that help plan for potential slow orders, Dick said. Projects like these that use existing data to gain additional information, or that leverage the power of simulations and modelling, are of particular interest throughout the industry, not only for the data they provide, but for the fact that they provide that data without the added expense of additional hardware, personnel requirements, or track time.
Validation and Calibration
The caveat to employing simulation and modelling is that the data they generate is only as good as the ability to validate it. To that end, the Federal Railway Administration (FRA) and the Transportation Technology Center Inc. (TTCI) have constructed a new adjustable test track at TTCI’s Pueblo, Colorado, test site. The track was built primarily to calibrate and validate various track geometry measurement devices.
The rail is adjustable vertically by up to 2 inches, and laterally by up to 1.5 inches. These adjustments are made by installing special shims in 1/8-inch intervals. “We can create a geometry anomaly with known characteristics and then measure with various equipment or geometry cars at various speeds,” said Ali Tajaddini, Program Manager at the FRA. The test track can also be used to validate simulations used by the FRA to approve high speed/high cant deficiency vehicles, he added. The FRA also plans to use the test track to perform yearly calibrations on its geometry vehicles as a matter of course, in addition to taking on various other specialized projects.
Manual Gauges
Handheld, analogue gauges may seem like an anachronism when compared to the cutting edge of simulation and automated inspection, but these systems still play an important role in the measurement technology ecosystem. The development of a set of manual pass/fail gauges for evaluating switch points at high risk for wheel climb derailments is an ongoing project, headed by Allan Zarembski, Director of Railroad Engineering and Safety at the University of Delaware, and Brad Kerchof, Director of Research and Tests at Norfolk Southern.
Identifying a frog at high risk for wheel climb is generally a matter of inspector experience, particularly because there are no specific metrics for switch point inspection, Kerchof said. Nonetheless, there are certain conditions typically present at wheel-climb derailments:
- A gapped, worn or broken switch point
- A worn wheel profile (with a worn flange root and sharp edge at the flange tip)
- Tracking position in which a worn wheel is shifted toward a compromised switch point
Thus, the goal of developing the gauges is to illustrate the wheel contact conditions that are possible for a given switch point with both new and worn wheels, and identify switch points that are at risk for wheel climb, Kerchof said.
In phase one of the project, Zarembski and Kerchof developed, modified and tested a set of gauges (based on those used by the UK’s Network Rail) to determine which were likely to be the most relevant and useful. (See more information at: http://interfacejournal.com/archives/1542).
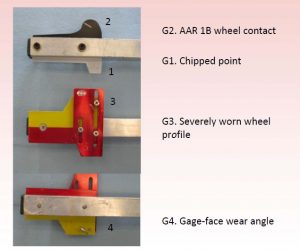
After initial feedback and testing, the gauges were modified further and one additional gauge was developed for testing. Phase two of the project saw further testing of the following four gauges:
- Chipped point gauge: if contact with the switch point is above the 60-degree hash mark: pass; if below: fail.
- AAR1B wheel contact gauge: if contact with the switch point is above the 60-degree hash mark: pass; if below: fail.
- Severely-worn wheel contact gauge: if the paddle freely slides down the gauge face of the switch point: pass. If the slider lands on the corner of the switch point: fail.
- Gauge-face wear angle gauge: if the switch gauge-face angle is greater than 58-degrees: pass. If it’s less than 58-degrees: fail.
These gauges were sent to six industry volunteers (railroads and consultants) for testing and feedback. Results showed that the severely-worn wheel gauge and chipped point gauge accounted for the majority of failed switch points that were identified. Data was also collected on how frequently inspectors agreed and disagreed with the gauge measurement. These results ranged from 49% to 77% in terms of agreement with the gauge findings, and 16% to 56% in terms of disagreement. “The clarity of instructions included with the gauges was probably the major factor in the discrepancies,” Kerchof said.
As a result of the feedback and test results, a number of modifications have been made to the gauges and the instructions on their use. In phase three of the project, these modified gauges and instructions will be sent back the original volunteers for additional testing. “These gauges are something of a training tool,” Kerchof said. “Once an inspector can reliably predict how the gauges will evaluate a switch point, the gauges have served their purpose.”
Despite the increasing prevalence of automated inspection systems, simulation and modelling, data mining and machine learning, it’s important to keep in mind the importance of human expertise and experience in the industry. The cycle of development and feedback is the mechanism that merges the theoretical and practical aspects of projects like those presented at the WRI conferences.

Jeff Tuzik is Managing Editor of Interface Journal.
Photos courtesy of Jack Lindquist.


