
Total Friction Management on CPKC’s Thompson Subdivision and Beyond
by Jeff Tuzik
In the railroad industry, friction management takes many forms. Managing friction through the application of lubrication and friction modifier products is a key component of maintaining an optimized wheel/rail interface. North American railroads typically use some combination of gage-face lubrication and top-of-rail (TOR) friction modifiers on various track sections throughout their systems. Canadian Pacific Kansas City (CPKC) has taken this a step further on their Western Corridor; they have developed a “100% effective lubrication and friction management strategy” known as total friction management (TFM).
CPKC has been a pioneer in the field of friction management since their “100% Effective Lubrication” study (which was conducted in 2000 and presented at AREMA in 2001). “This was one of the first large scale lubrication studies in the industry,” Marco Santoro, Manager of Global Friction Management Applications at L.B. Foster, told attendees at the 2025 Wheel/Rail Interaction Heavy Haul conference. This study focused on lubrication in a section of the Thompson Subdivision but has since been expanded to include top-of-rail friction management, as well, and has been expanded to the entire Western Corridor (which includes the Thomson Subdivision). Results from these studies and subsequent updates have been published and presented at the International Heavy Haul Association in 2005 and 2009.
The 2000 study focused primarily on maximizing the effectiveness of lubrication through the use of modern (at the time) lubricators and application bars, non-contact wheel sensors and improved lubricant characteristics, Santoro said. Prior to this, CPKC and other class 1 railroads used molybdenum lubricants rather than the petroleum-based greases designed specifically for rail application that later replaced them.
The initial results of the program were dramatic: an 85% reduction in average rail wear in sharp curves, Santoro said. (For more information on this study and others like it, see Management and Maintenance: Capitalizing on Friction Modifiers – Interface Journal)
The 2000 program and subsequent studies in 2005 and 2009 also focused on maintaining the benefits of lubrication by dedicating maintenance crews to the lubricators, performing bulk filling of the reservoirs, centralizing oversight of the friction management program and budget, and taking regular measurements to assess program effectiveness.
However, since the time of these studies, CPKC noticed a slow but steady decline in the performance of their TFM program, Santoro said; the result of a combination of factors. “The gage-face equipment was installed in 2001, TOR was added in 2005. Unfortunately,” he said, “pump output declines over time.” Increased traffic, up to ≈4 million axles per year, also put a strain on lubricator maintenance and bulk filling cycles, he said. There were also difficulties with seasonal changeouts of greases to accommodate the wide temperature swings of Western Canada. “Winter greases don’t transfer to the rail very well in warmer weather,” he said, “they’re simply picked up by the wheel flanges and flung off.”
Revitalizing the TFM Program
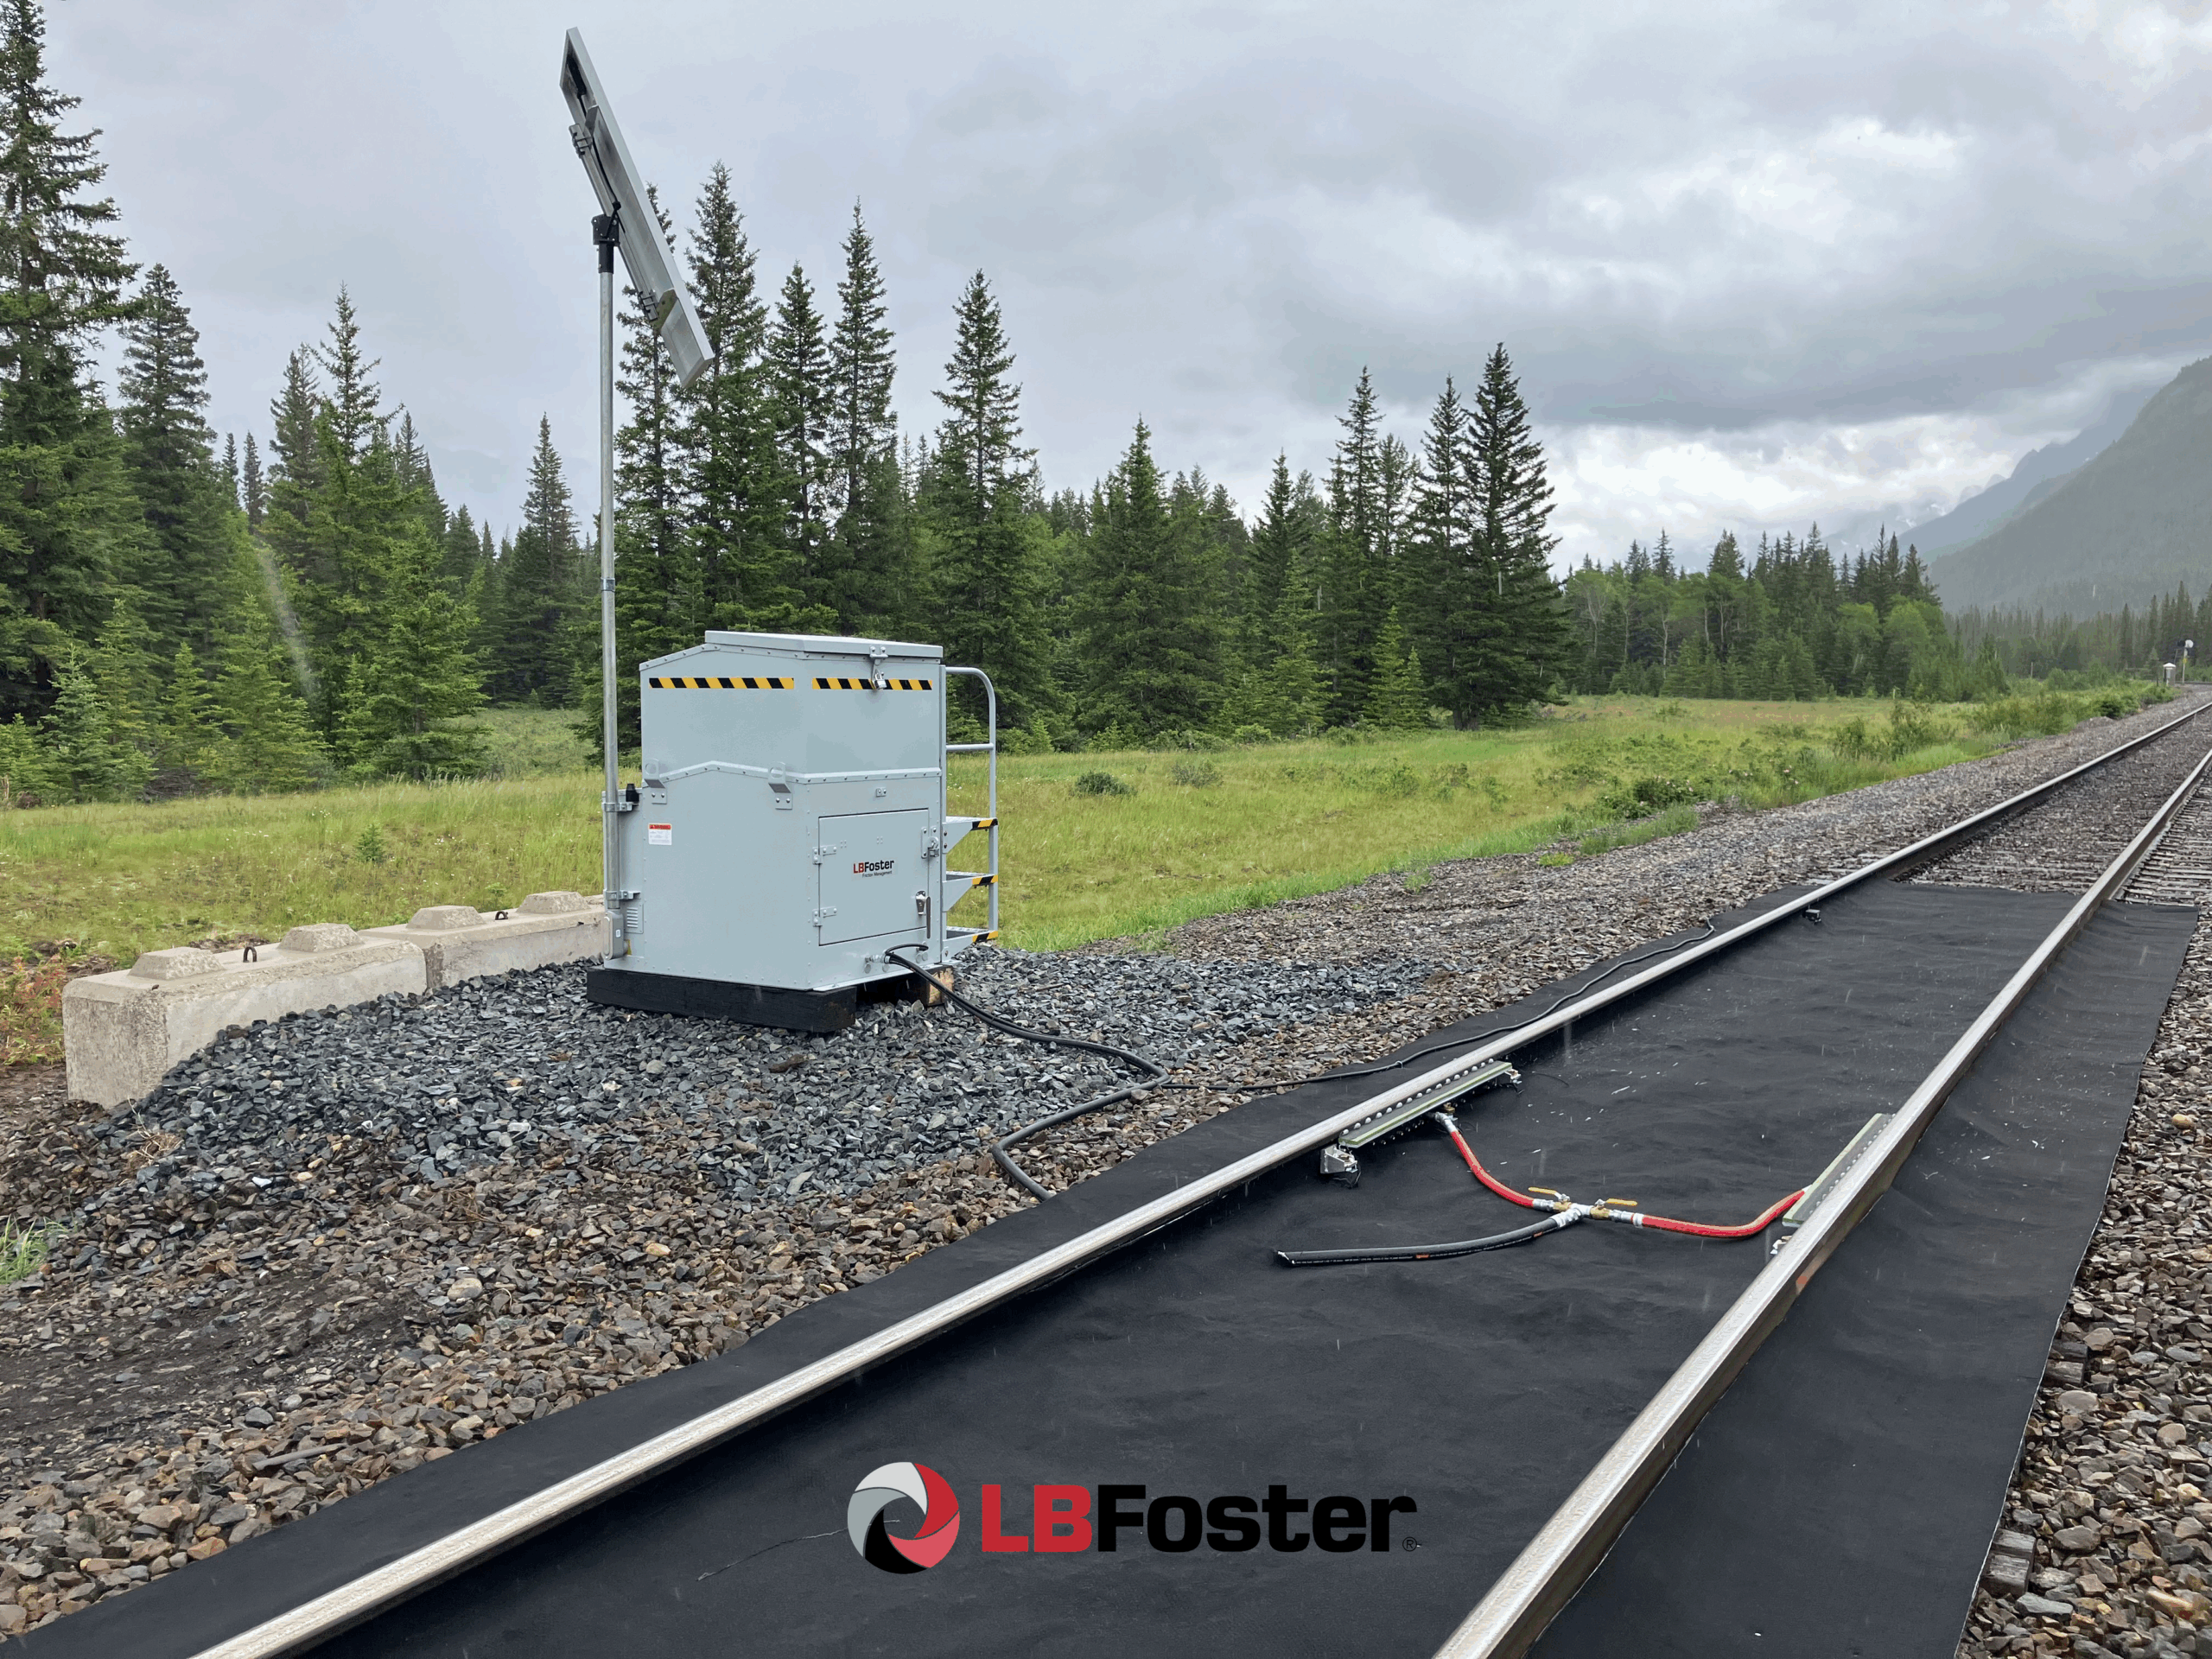
Faced with the faltering effectiveness of their TFM program, CPKC made a number of significant upgrades and optimizations beginning in 2019. The first was the replacement of their aging gage-face lubrication units with new models. Among other upgrades, these units featured a significantly larger reservoir (1250 lbs versus 800 lbs), meaning bulk filling cycles could be significantly extended, said Greg Harrington, Manager of Rail Maintenance – System at CPKC.

Concurrent with the applicator upgrades, CPKC also switched from seasonal petroleum greases to a synthetic all-season grease. Because of its wider operating temperatures, the grease no longer required seasonal changeouts, Santoro said. Its greater retentivity also allowed CPKC to achieve the same benefits as their previous grease, but with lower application rates; figure 1 shows twin disk testing conducted by the National Research Council of Canada (NRC) comparing retentivity between traditional petroleum grease and an all-season synthetic grease developed for use in curves.
CPKC also conducted extensive field trials comparing petroleum grease and the synthetic all-season grease on their Shuswap Subdivision in 2018 and 2019, measuring both rail wear and product output rates. Data originally presented at AREMA in 2020 showed a 40% reduction in rail wear at roughly half the application rate of their previous petroleum greases, Santoro said.
Because of the reduced output rate that was required—0.30 – 0.45 lbs per thousand axles versus 0.75 lbs per thousand axles—and due to the larger reservoir size of the new applicator units, the number of days between product fill-ups was greatly increased, CPKC’s Harrington said. While the old models went 50 days between fill-ups with petroleum grease, the new models with synthetic grease go for 172 days. “This means that overall, the new units require a 71% reduction in track access time for bulk filling operations,” he said.
Another improvement CPKC made to the TFM program was the design and implementation of specialized bulk filling trucks. Prior to 2020, bulk filling was done by moving totes loaded with product on and off trucks via crane and pumping product in or out of each tote individually—a time consuming and thus costly operation, Harrington said. The bulk filling trucks carry both lubrication and FM product and internal pumps; there are no totes to transport, and no crane-work involved. This means that a worker can now generally fill 8, rather than only 4 units per shift, he said. “Extrapolating this out for a worker’s entire FM applicator filling duties, we estimate this saves us roughly $60,000 a year in labor and overhead costs.”
CPKC remotely monitors the performance of all GF and TOR units in the Western Corridor, including the Thompson Subdivision. “Remote performance monitoring is critical to a successful friction management program, especially when you’re dealing with large numbers of units over vast territories,” L.B. Foster’s Santoro said. The data CPKC collects allows for precise maintenance and filling planning, and it allows them to analyze and remediate causes of applicator downtime.
Another performance indicator for the TFM program is rail wear rate(s); these measurements are taken as part of CPKC’s overarching autonomous and manned track inspection program (see Autonomous Inspection on CPKC and the Future of Track Inspection – Interface Journal for more information on these programs). “Railways are already collecting this data, and with a little post-processing, it can be applied to friction management programs to monitor their performance,” Santoro said.
The Thompson Subdivision
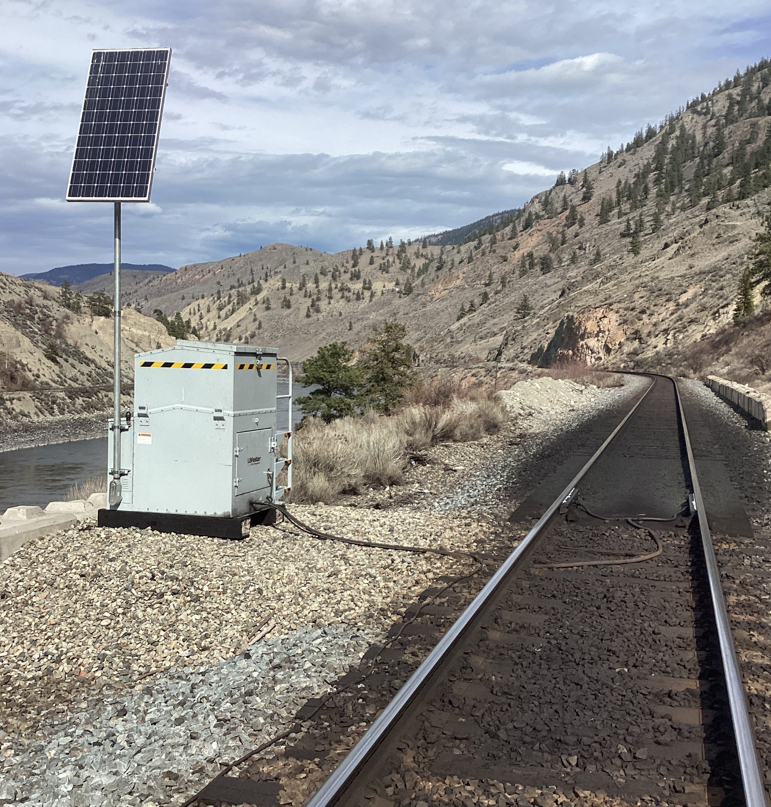
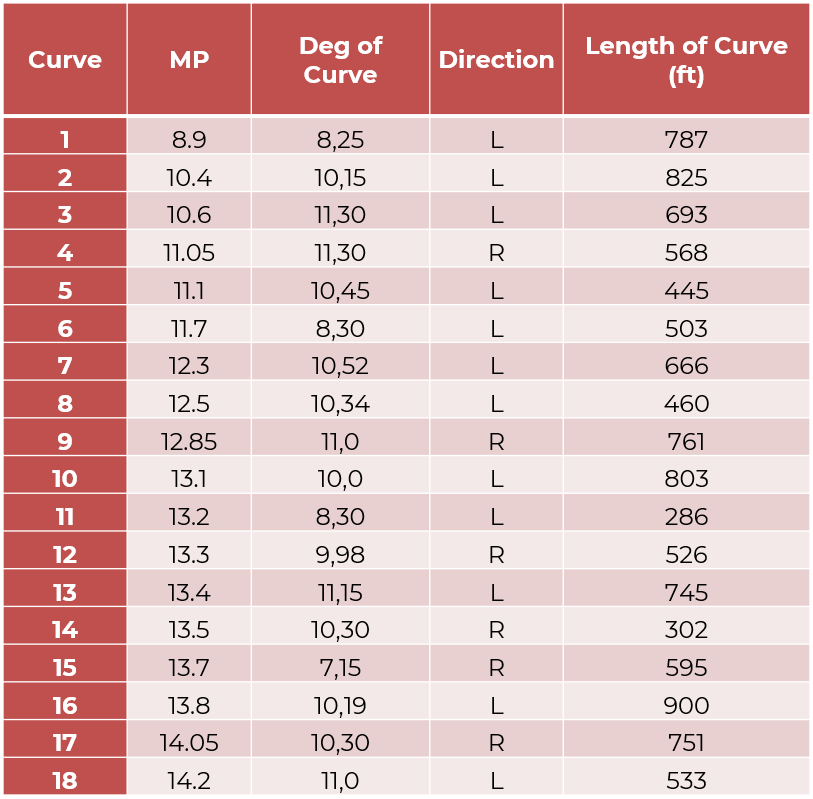
CPKC and L.B. Foster recently conducted a new study focusing on the Thomspon Subdivision to assess the impact of the optimized TFM program. CPKC looked closely at an area of very high curvature in the Tranquille/Cherry Creek area—the same area of focus as in the 2000 “100% total lubrication” study. There is a total of 18 sharp curves in the area, ranging from 7 degrees, 15 minutes to 11 degrees, 30 minutes (see figure 2 for details). Annual traffic is roughly 100 MGT. Four gage-face lubricators protect this section of track applying synthetic grease, Santoro said.
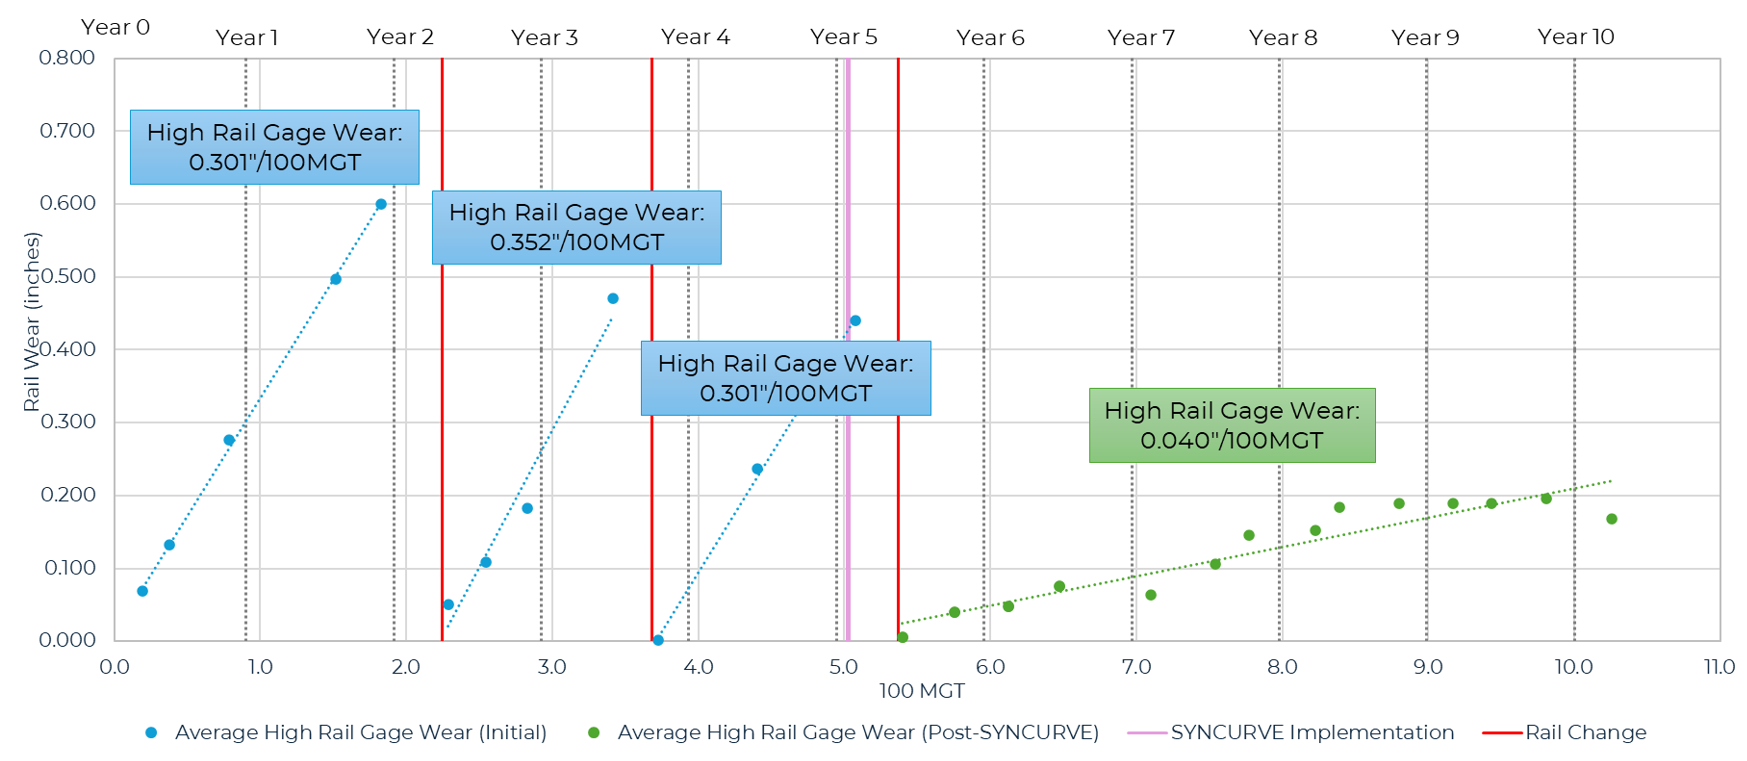
Figure 3 shows combined high rail gage wear for a 10-degree, 45-minute right-hand curve located at milepost 13.5. The blue trend lines show gage wear over time. The vertical red lines indicate rail replacement. “[In the blue trend lines] we’re seeing the effects of poorly optimized friction management,” Santoro said, “This curve was averaging about 0.3 inches of wear per 100 MGT.” The vertical purple line in the figure indicates when CPKC implemented the previously mentioned upgrades and optimizations to their TFM program. The green trend line to the right shows the dramatic reduction in wear following these changes. “This curve is now down to 0.04 inches of gage wear per 100 MGT, which has held steady now for roughly 700 MGT,” he said.
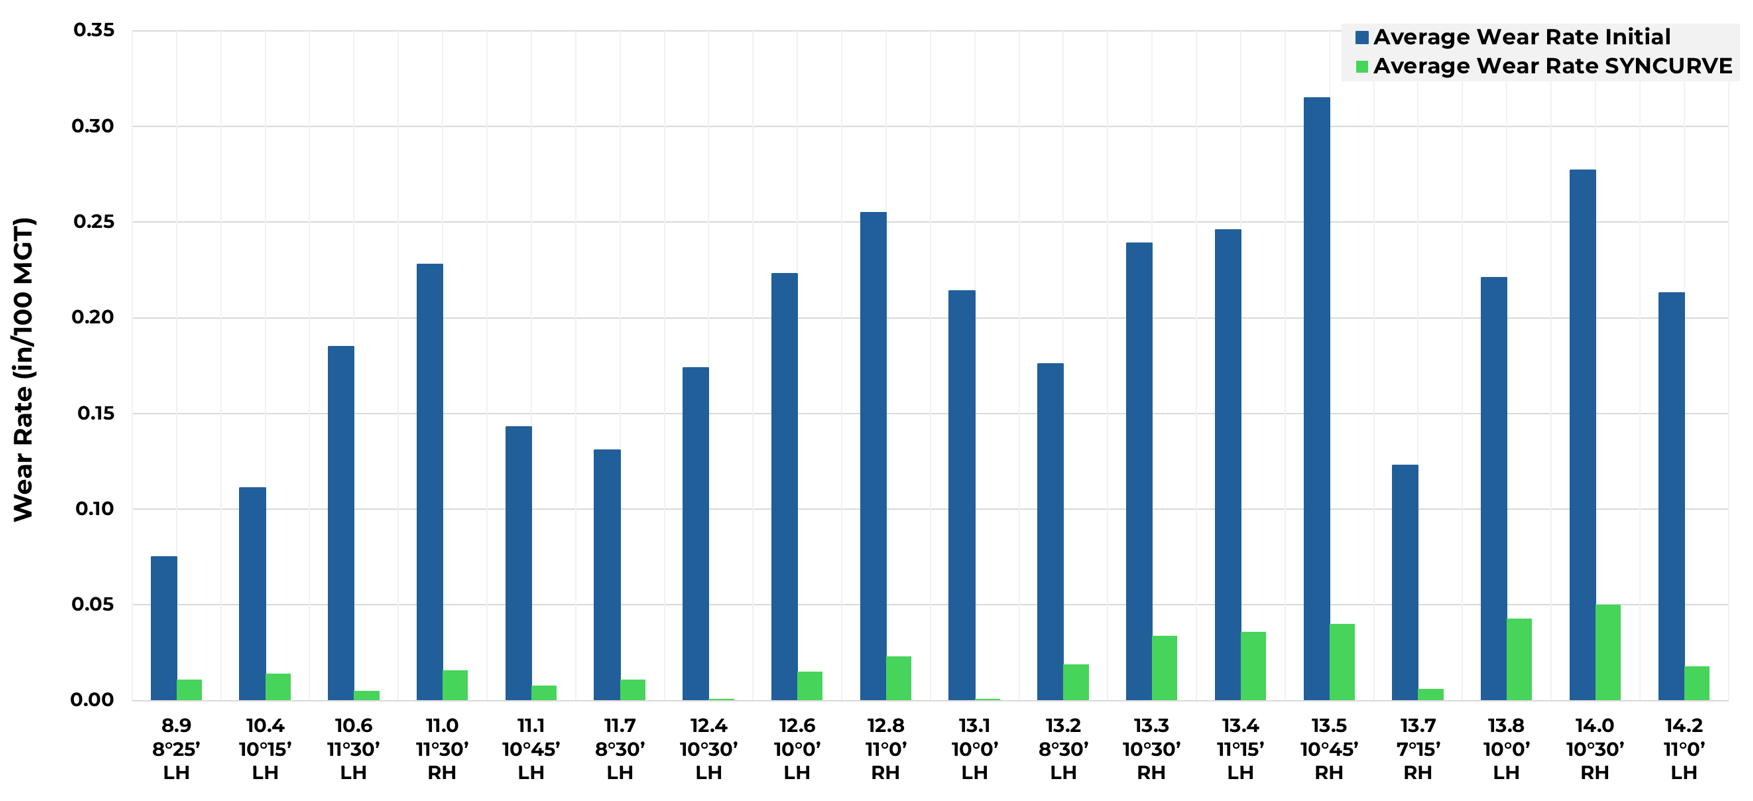
These results are echoed in the other curves in the test area. Figure 4 shows wear rates in inches per 100 MGT for all 18 curves. The blue bars show data from the time prior to TFM optimization, while the green bars show data after the upgrades were implemented. The results show a roughly 90% reduction in rail wear rates under the optimized TFM program versus the aging, non-optimized program, Santoro said.
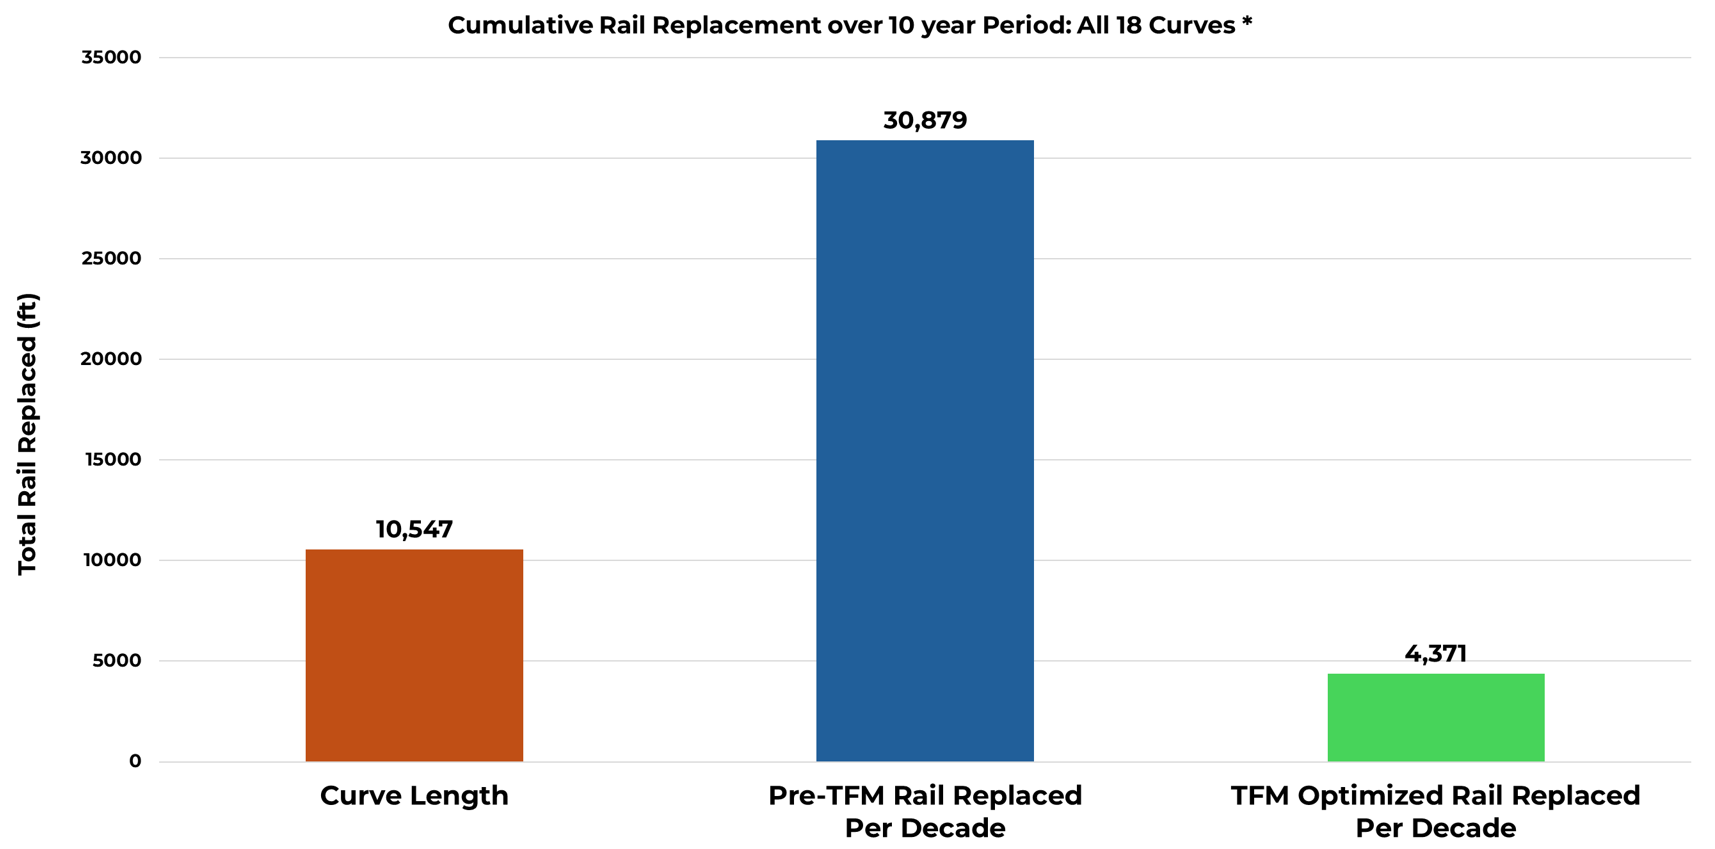
CPKC used the data from these results, including both pre- and post-TFM wear rate data, and average wear rates from the 18 curves in the study, to calculate the projected rail saved per decade (in feet) and the dollars saved per decade (in materials, labor, consumables, and overhead). Figure 5 shows rail replacement in feet per decade for these curves—the blue bar represents pre-TFM figures, and the green represents optimized TFM figures. “For these 18 curves alone, we calculated a savings of $2,665,431 per decade,” Harrington said. “And this test area represents only 5% of the total subdivision.”
While many studies have been conducted that show the various benefits of friction management, few are as comprehensive as those conducted as part of CPKC’s TFM program over the years. The data shows that a fully optimized TFM can bring unparalleled long term economic benefits. Studies like these are important not just to the railroad that conducts them, but to the entire industry, helping to spread knowledge of optimization strategies and best practices.

Jeff Tuzik is Managing Editor of Interface Journal
This article is based on a presentation made at the 2025 Wheel/Rail Interaction Heavy Haul conference.
Images are courtesy of CPKC and L.B. Foster except where otherwise noted.