Taking the Long View: 20 Years of Wheel/Rail Interaction (Part 2 of 2)
Part 2. Friction Management, Vehicle Suspension and Measurement Systems
By Bob Tuzik, April 2014
Part 1 of this article explored advances in metallurgy, wheel/rail profile design and maintenance practices. Part 2 continues the theme, examining the technologies and techniques that have shaped our understanding of wheel/rail interaction.
While the practice of oil-based, gauge-face lubrication was established long ago, railroads didn’t have a clear, quantifiable understanding of the value of lubrication until fairly recently. The first significant evidence was presented in the 1980s by the Association of American Railroads (AAR) in a seminar devoted to lubrication, which showed that there was a two- to three-fold improvement in rail life with regular lubrication.
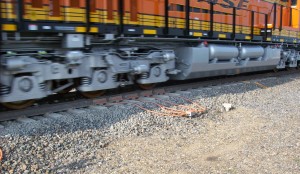
Photo courtesy of International Engineering.
This captured railroads’ attention says Michael Roney, chairman of CPCS Transcom and recently retired from Canadian Pacific. Norfolk Southern, he said, was the first railroad to really understand and implement an effective lubrication program. CP followed their lead. “We started to put more emphasis on lubrication – installing better lubricators, longer wiper bars, and paying more attention to lubricator maintenance and performance,” Roney says.
With greater attention paid to lubrication programs, railroads began reaping the benefits associated with gauge-face lubrication, which can reduce the coefficient of friction (COF) at the wheel flange / gauge face from 0.6, the COF represented by a dry wheel on dry rail, to 0.15 or lower. But not all wear and performance-related problems were remedied — the proof of which was shown in a series of low rail rollover derailments on Class 1 railroads that occurred on the heels of the doublestack derailments (see Taking the Long View: 20 Years of Wheel/Rail Interaction Part 1. Metallurgy, Wheel/Rail Profile Design and Maintenance). This time, however, the problem was associated with coal and other heavy commodity cars. The derailments occurred under the first train to occupy the track immediately after rail grinding.
Piggy backing on the findings from the double stack committee, researchers found that freshly ground rail generated a COF of 0.6 or higher on the tread surface of the rail – far in excess of the “ideal” COF of 0.35. “As a result, lateral creep forces were through the roof, says Gary Wolf, president of Wolf Railway Consulting.
A debate about how to properly grind the high rail in curves ensued. Along with it, came rudimentary implementation of a budding concept: friction management. Initially, “friction management” consisted of swabbing the running surface of the rail with a broom dipped in grease. “In initial tests we treated the rail at the entry to a curve and, bingo, the lateral forces went down,” Wolf says. “We let it dry out over a few trains and the forces climbed back up. In the end, we showed a direct correlation between top-of-rail lubricant and a reduction in lateral forces.”
This, of course, preceded the now well-accepted concept of friction management, which didn’t enter the lexicon until the 1990s.
“Railroaders recognized that when it rained, friction forces were reduced,” says Eric Magel, Principal Engineer at the National Research Council of Canada’s (NRC) Rail Division at the Centre for Surface Transportation Technology. “Some railroaders and transit operators even used a water hose to reduce friction and squeal on problematic curves.” But there was no science behind friction management until companies like Kelsan, now part of L. B. Foster, developed an engineered, water-based top-of-rail (TOR) friction modifier that could establish and maintain a consistent level of friction at the top of rail, he says. The product was designed to maintain a constant coefficient of friction (COF) between 0.2 and 0.4 (compared to about 0.7 for dry rail) so that it could be applied to the top of the rail without impacting locomotive tractive effort or braking distances.
Science notwithstanding, the notion of applying a friction modifier to the top of the rail was initially hard to sell. Aside from their reluctance to “lubricate” the top of the rail, track maintainers couldn’t see the effect of TOR friction modifiers like they could with traditional gauge-face lubrication. As messy as traditional lubrication was, track maintainers could see the grease on the gauge face of the rail. And when there was no grease they could see metal shavings accumulating at the base of the high rail in curves.
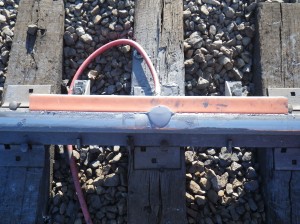
“You don’t have that direct connection between eyeball and performance with TOR,” says Brad Kerchof, Norfolk Southern’s Director of Research and Tests. The friction modifier is so thin it’s difficult to see on the rail. And unlike the evidence that accumulates with wheel-flange / gauge-face contact, you can’t see the increased contact stresses between wheel tread and top of rail, he says.
But through a long education process aided by extensive testing on early adopter railways such as BC Rail, now part of CN, and through controlled testing on the high tonnage loop at the Transportation Technology Center Inc. (TTCI), TOR friction modifiers were shown to be suitable for the heavy haul environment.
CP began wayside application of TOR friction modifiers around 2000. “Like the other Class 1s, we saw around thirty percent reductions in lateral forces and four to eight percent fuel savings, as well,” says Mike Roney.
Railways also adopted on-board, locomotive- and car-mounted application systems for liquid-based TOR material, which typically applied the liquid-based friction modifier to the rail behind the last powered axle. (Transit systems often opt for vehicle-mounted solid stick applicators that apply friction modifiers designed to apply the appropriate COF levels directly to the wheel flange and tread surfaces, which then deposit it on the rail to maintain a COF of 0.2 or less at the wheel flange / gauge corner and a COF of 0.2 – 0.4 at the wheel-tread / top-of-rail surface.)
While focused friction management programs have yielded significant benefits, reducing fuel consumption and high lateral loadings associated with high wear, poor curving performance and low rail rollover derailments, its full potential is yet to be tapped, Roney says. “We haven’t, for example, found the sweet spot between wayside and on-board application, yet. We are using wayside units in places where we should be using train-mounted units, instead.”
The industry also has begun experimenting with oil-based TOR friction modifiers in addition to water-based products to potentially reduce costs and extend the carry-down rates related to wayside applications.
“If you can carry four miles instead of two miles, you reduce your TOR material consumption by fifty percent. That represents a couple million dollars a year for a railroad like us,” NS’s Kerchof says. Hydrodynamic crack growth rates associated with friction modifiers may also be a factor, however. Are we going to have a problem with accelerated crack growth by introducing material that remains liquid or oily for mile after mile?” Kerchof asks. “Will doing a good job of rail grinding to minimize cracks keep us out of the woods? Will the longer carry TOR materials with a COF less than 0.4 affect adhesion or curving performance?”
These and other questions have generated renewed interest in the development of a “high-speed” tribometer that can accurately measure the COF of the rail surface at hi-rail operating speeds.
An International Collaborative Research Initiative (ICRP), which includes experts from around the world, was recently established to look into rolling contact fatigue (RCF) and friction management, which includes measurement and data modeling.
Vehicle Performance
Vehicle suspension systems play a role in improving wheel/rail interaction, too.
“At one point, we believed we needed steerable trucks to handle our high-curvature high tonnage lines,” Roney says. Instead, CP and the other Class 1 railways decided that they needed a specification for trucks that steered better and hunted less. The M976 specification adopted in 2003 provided that.
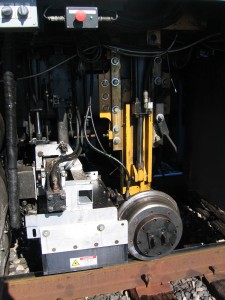
Photo courtesy of Holland LP.
Another significant improvement was the move to constant contact side bearings (CCSB), which help prevent hunting behavior and maintain good wheel profiles. CCSBs came into prominence in the 1960s. More cars were fitted with metal- and non-metal-capped CCSBs with the growth of intermodal traffic and the need to operate at higher speeds during the 1970s and ‘80s.
Doublestack cars with shared, articulated trucks created a fresh set of performance issues, as the greater turning resistance of the articulated trucks during curving increased the potential for derailment. As a result, manufacturers developed long travel CCSBs, which allowed 5/8 in., or twice the travel allowed by standard CCSBs. This raised the threshold speed at which lateral instability takes place, and improved the vehicle’s ability to negotiate curves. After extensive testing at the TTCI, the AAR mandated that all new cars ordered as of 2002 must be equipped with CCSBs; it modified the mandate to require metal-capped, long-travel CCSBs the following year. The mandate was extended to include tank cars in 2005.
Gary Wolf points out that truck warp also had a significant effect on wheel wear / wheel life. “Wheels wear out because the trucks warp. Wheels are condemned for flange wear long before they are for tread wear,” he says. While it was clear to truck manufacturers in the early ‘90s that controlling wedge rise was critical to controlling truck warp – especially in the 125-ton loading environment – limits for wedge rise were not added to the AAR interchange rules until 2007.
As with other vehicle track parameters, manual inspection, typically done with calipers and feeler gauges in all types of conditions, was hardly accurate.
“Twenty years ago, inspectors would find the problem about fifty percent of the time,” says Ryan McWilliams, Chief Technical Officer of International Engineering. “They did a great job for what they had to work with, but they were out there in terrible environmental conditions and they missed a lot.”
Automated Measurement Systems
You know the adage: You can’t manage it if you can’t measure it. It took a little while for the message to sink in, but railroads, today, are all in, routinely utilizing a plethora of vehicle and track measurement systems, many of which were in their infancy twenty some years ago.
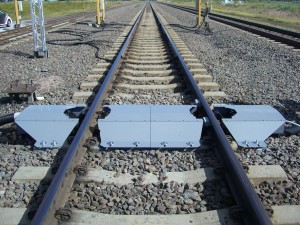
“We take a lot of it for granted today, Gary Wolf says, “but the ‘90s were the breakout time of when our understanding all came together.”
One of the important early innovations was the development of the laser-based rail profile collection systems, Wolf says. Norm Hooper, then chief engineer of the former BC Rail (now part of Canadian National), worked with Range Vision to collect data and to develop Rangecam software, which used the collected data to monitor rail wear, perform trend analysis and forecast when rail would be worn beyond the established limits. “The notion of periodically measuring rail to identify wear patterns was a breakthrough,” Wolf says.
The rail grinding industry has benefited immensely from the use of laser-based rail profile measurement systems, which analyze the in-field rail profile against the target rail template profile and provide the machine operator direct feedback on pre-grind planning and post-grind quality, says Dan Magnus, Vice President of KLD Labs, Inc. “More recently, rail grinders and survey vehicles have also deployed machine vision systems to assess the running rail surface conditions for the evaluation of surface defects.”
Another innovative tool on the track side was the development of the Gauge Restraint Measurement System (GRMS), which Ensco built for the FRA railbound cars, and Holland LP incorporated on a fleet of high rail vehicles. GRMS, which uses a split axle to apply up to 14,000-pound lateral loads, has been used to determine the track gauge strength. The ability to identify poor track gauge strength was crucial to solving the rail the rollover problem, which was related in part to clusters of bad ties, Wolf says. “I was amazed while working on the first GRMS car by how well it picked out bad ties.”
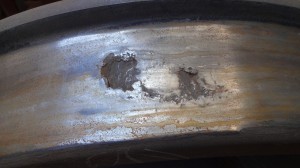
Automated systems, such as Wheel Impact Load Detectors (WILD) which first appeared in the mid 1980s, provided a great compliment to the manual systems in place. It soon became clear that the systems were more effective than the car inspectors with manual gauges at identifying shells and skid flats on the wheel tread surface and high-impact out-of-round wheels, which inspectors simply couldn’t see.
WILD systems proved so effective in identifying high impact loads as the detector network grew through the ‘90s (there are approximately 120 WILD systems in North America today), that the AAR determined that they could be used for compliance. The 90-kip WILD rule (Why Made Code 65), which required WILD readings to be validated by a hand-operated out-of-round gage, was implemented and incorporated in the AAR interchange rules in 1998. The rule was revised with the addition of system calibration requirements to be used as a standalone reading in 2004.
A host of other measurement systems were introduced along with or on the heels of the WILD systems, which now measure millions of wheels per day. Among them were acoustic and hot bearing detectors, wheel temperature detectors, wheel profile measurement systems, cracked wheel detectors and truck performance detectors (TPD). TPDs, which were introduced through a jointly funded development program by BC Rail and Quebec Cartier Mining, provided “great insight into the concept of a bad-actor car,” Wolf says. And they started a wave of research into vehicle performance-related issues.
A growing number of machine vision systems are now being used to inspect a wide range of vehicle components, including brake rigging and draft/coupler components located on the hard-to-inspect undercarriage. They are also being used to inspect truck / suspension systems and to identify missing wedges, bearing cap screws, and missing or broken truck springs.
“With an automated wheel profile measuring system and a system to measure wedge rise combined with TPD data you can pretty much diagnose what problem needs to be fixed on a truck,” Wolf says. “If a TPD identifies a bad-actor truck that’s not steering, and you’ve measured the wheel profile and it’s good, and you’ve measured wedge-rise and it’s good, you can take two or three potential causes out of the equation. The thing that’s left is that you might have to fix side-bearing clearance.”
Similar technologies are also being used to monitor track conditions. Track geometry measurement augmented with laser-based rail profile systems have long been the norm on North American railroads. They are now being augmented with machine vision systems to identify defective timber and concrete ties, missing fasteners, cracked joint bars and other component conditions. Ensco’s locomotive mounted Vehicle Track Interaction (VTI) system is being used by every Class 1 and numerous other railroads to repeatedly identify deviations in track as the locomotive “sees” them. Ground Penetrating Radar systems are being used to identify potential problem areas, relating to high moisture, low soil modulus and the presence of pockets within the ballast.
Conventional ultrasonic rail inspection, which has long been used to identify internal rail defects, continues to be improved with advancements such as phased array rail flaw detection, which provides the ability to scan, focus and steer UT beams through various angles of inspection and provide full railhead coverage.
Another promising breakthrough is the use of eddy current technology to accurately measure crack depth, a critical aspect of controlling RCF. Tests of cross sections of rail on Norfolk Southern have verified the depth of 1 mm or 2 mm cracks, as measured by Rohmann LP’s eddy current technology, Kerchof says. Crack measurements greater than 2 mm have not been substantiated yet.
With the data from the myriad measurement systems that railways now possess comes the ability to monitor vehicle and track performance and to generate and analyze wear and defect trends. This, in turn, provides the ability to move from reactive to preventive maintenance practices. Regulations now enable railroads to perform “opportunistic repairs” on wheels reporting 80-kip impacts (less than the AAR 90-kip interchange limit) if the car is already on a designated repair track for another reason.
With the number of detectors in place, one of the biggest problems as railroads continue to expand their network of detectors is data overload. The industry needs another level of automation that turns the data into information that railroads can act on. This applies not only to each of the individual types of measurement / detection systems, but also to an integrated cross-detector network.
“The mantra is to combine more detector data together to make smarter decisions,” Ryan McWilliams says. “Figuring out how to tie all this data together is the next challenge. It’s too big an issue for any one supplier to tackle.”
“The most important thing is to understand that all of this – the wheel/rail interface is a system,” says the NRC’s Eric Magel. And some industry champions have led to a good understanding of that now.
Going forward, the industry has to ensure that the current level of understanding isn’t lost when the boomer generation of champions retires and that the next generation of innovators keeps the momentum going.

Bob Tuzik is editor-in-chief of Interface Journal
