WRI 2016 – Transit: Integration, Correlation, Remediation
By Jeff Tuzik
It’s easier now than ever to collect data on wheel/rail interaction. The number of measurement tools, the number of parameters that can be measured, and the accuracy of those measurements have changed the way wheel and rail systems are designed, monitored and maintained. While all of these measurements are valuable in their own right, the real potential is in integrating and correlating data sets to illuminate system characteristics or trends that might otherwise go unnoticed. Integrated data analysis isn’t a new concept – it has always been a part of the Big Data discussion – but it’s a concept that many rail systems are beginning to address in tangible and practical ways. Many of the presenters at the Wheel/Rail Interaction 2016 – Transit conference shared their experiences in taking a systems approach to wheel/rail interaction and a systems approach to data analysis.
One of the most ambitious projects to date in terms of integrating and analyzing various wheel and rail data is currently underway on the New York City Subway. The project, which is supported by a Federal Transportation Administration (FTA) Office of Research grant, is a collaborative effort between the FTA, New York City Transit Authority (NYCTA), and a number of railroad suppliers and consultants, which includes the National Research Council of Canada (CNRC). The aim of the project is to explore wheel/rail interaction through advanced measurement and analytics.
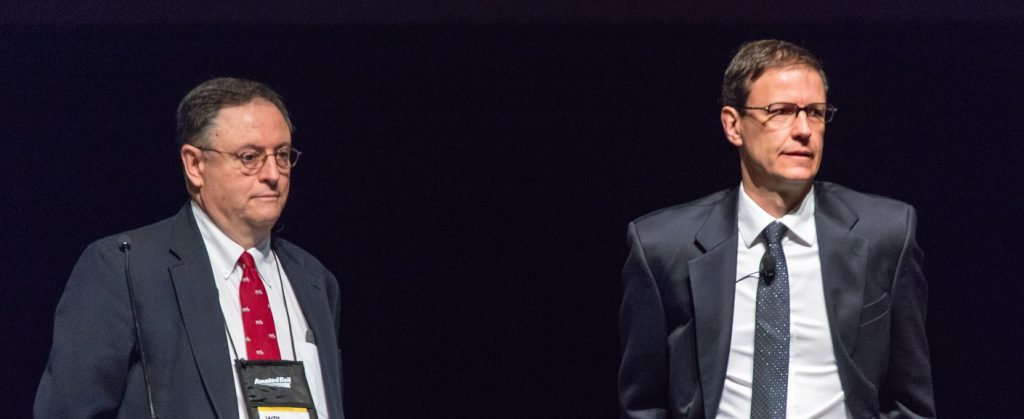
Tony Cabrera, Director of Track Engineering at New York City Transit Authority and Eric Magel, Principle Engineer, Canadian National Research Council.
Some of the groundwork for the new collaboration was laid four years ago with NYCTA’s automated track inspection pilot program. The pilot program, also supported by an FTA research grant, provided the NYCTA an opportunity to explore the viability of machine vision technology on NYCTA’s automated Track Geometry Car 4 (see also WRI 2014: Transit). In addition to machine vision systems, the TGC-4 collects geometry, thermal imaging, rail profile and ultrasonic rail flaw data. In terms of machine vision capabilities, the TGC-4’s line scan video cameras are employed to find defects such as cracks on the rail surface or broken joint bars. The pilot program matched the TGC-4’s measurement data to the video images for correlation and validation. The impetus for adding machine-vision to the TGC was to limit track inspector exposure to track, and to provide visual inspection data at revenue speed and under load. The program successfully concluded in 2012. “Video cameras on the [track geometry] car have proven to be useful tools. It’s very useful to have a permanent, objective record of inspection,” said Tony Cabrera, Director of Track Engineering at NYCTA.
The new NYCTA collaborative project will use the measurement capabilities of the TGC-4, as well as a number of additional tools. The project will take place on the Flushing Line, the same line used in the prior project. But the new project has different, and broader, goals. The FTA grant, in broad terms, is to “improve the safety, resiliency and economics of NYC transit,” said Eric Magel, Principle Engineer, Canadian National Research Council. To that end, the project will focus on the integration and analysis of data from a large number of measurement systems.
The first phase of the project is to implement the various track- and vehicle-based measurement systems. On the track side, these include a KLD Labs WheelScan unit for measuring wheel profiles that pass through a given site. For the project, all trains will pass through the WheelScan site at least once a week. Several curves will be instrumented with strain gauges on the high and low rails to measure L/Vs. And a Wayside Inspection Devices’ TBOGI system will be employed to measure bogie geometry parameters, such as wheelset tracking position and angle of attack.
On the vehicle-side of things, a number of technologies will be installed on a measurement car. This car, part of an 11-car consist, will make a round-trip of the Flushing line at least 10 times per day, and will be equipped with instrumented wheelsets, accelerometers, acoustic measurement tools, and propulsion energy monitoring equipment. Additionally, Plasser American will provide tools to measure effective conicity in order to get information about vehicle steering and stability characteristics.
“This particular project also has a strong requirement for fuel savings/energy reduction,” Magel said. Data on energy consumption in various conditions, such as through curves and tangents, on wet days and dry days, could be used to optimize propulsion and braking in order to reduce overall energy consumption, he said.
But the accurate repeated measurements provided by the project will also facilitate optimization in areas like wheel and rail profile selection, wheel re-truing intervals, friction management, train speed and superelevation, and maintenance prioritization. “There’s a huge amount we can do with the information we’ll be collecting,” Magel said.
The wealth of data provides a unique opportunity for the development and refinement of analytics that draw on multiple, disparate data sets. “Each measurement tool provides a valuable set of information on its own, but we want to put it together,” Magel said.
The first 18 months of the project, which is now underway, will be spent on instrumentation and validation of the instruments. The next phase will focus on developing and optimizing analytics; the final phase is to determine the highest-value change that can be made to the system and then to do an in-track demonstration, Magel said. Tony Cabrera and Eric Magel noted that they hope to present findings from phases 1 and 2 at WRI 2017.
While the scope of the NYCTA project is unprecedented, a number of transit systems have been able to realize the benefits of integrating various data and techniques to address wheel/rail interaction from a holistic standpoint. One such example is the ongoing Toronto Transit Commission (TTC) subway optimization project.
As a result of wheel life issues related to skid-flats, heavy rolling contact fatigue (RCF) and high wheel/rail noise, the TTC recently initiated a program to optimize wheel/rail interaction across the Subway and Linear Induction Motor (LIM) propulsion system. In order to address the various issues from a system standpoint, rather than a piecemeal approach, the TTC had to bring its departments together to collaborate with each other and with outside expertise.
TTC partnered with Advanced Rail Rail Management (ARM), CNRC and ATS Consulting to tackle an ambitious set of goals: to reduce noise levels, improve wheel life, minimize RCF, optimize friction management, and to develop a maintenance and monitoring program going forward.
Like the NYCTA project, this is still underway. And, like the NYCTA project, one of the major challenges and opportunities is in data integration and analytics. “We’re integrating a lot of disparate data that we haven’t done before, and a lot of this integration is essentially done by hand,” said Teever Handal, Senior Engineer, Vehicle/Track Systems at Advanced Rail Management. “In a perfect world we’d like to have the same program they have in NYC. I think everybody would,” he added.
One of the big hurdles going forward with these sorts of large scale optimization projects, Handel said, is to develop a kind of standardized “hopper” for the different data sets. Eric Magel added that, for the NYCTA project, the primary focus is in integrating the data. “The deliverable is not a working wheel/rail analytics system, but rather to develop the analytics themselves,” Magel said.
There is a clear opportunity for a supplier to integrate all of the data sources involved in these types of projects and put it into a streamlined platform that can overlay multiple system measurements of key performance indicators, Tony Cabrera added. (For more on this topic, see articles on Big Data and Data to Decisions).
London Underground
The holistic or integrated approach to managing wheel/rail interaction has been a major success in one of the busiest transit systems in the world, the London Underground. One of the early cases that helped make the case for developing a dedicated wheel/rail interaction team had to do with wayside lubrication units. Wheels were developing skid-flats at high rates, rail wear in certain curves was unacceptably high, and certain car undercarriages were coming into the shop covered with grease.
An investigation determined that the root of the problem had to do with lubrication (see WRI EU Part 1). Part of the problem was that the grease viscosity was sensitive to seasonal temperature changes.
Lubrication and friction management programs can have a lot of benefits, but like any other part of the system, they have to be tuned to the system. “The product you use has to match the operating environment,” said Marco Santoro, Technical Solutions Manager, L.B. Foster. Synthetic high-performance lubricants, for example, tend to cost more than petroleum products, but they also tend to be more stable and less sensitive to temperature change, he said.
In LU’s case, part of the solution was to switch to a different lubrication product. Another issue was that certain consists that passed through the wayside lubrication sites were triggering grease dispensation but failing to pick it up and carry it down track. As a result, every third train was effectively picking up three trains worth of lubricant, said Andy Vickerstaff, Senior Wheel Rail Interface Engineer at London Underground. As a result, lubricant ended up places it shouldn’t be: on wheel treads, brake actuators and car undercarriages. Rather than treating only the symptoms, the LU WRI team drilled down to the core issue and as a result, benefitted the system as a whole. “This really helped to make the business case for a dedicated wheel/rail interaction team,” Vickerstaff said.
Since then, LU has continued to collect data on numerous aspects of wheel/rail interaction in order to develop a baseline for system performance. “You need data across all areas: wheels, rail, adhesion, propulsion. There’s no point in looking at one part of the system without the others,” Vickerstaff said. That data is now guiding the development of LU’s preventive rail grinding program and helping to optimize its wheel-turning strategy, he said.
London Underground plans to further leverage this collected data in order to more accurately model system wear and predict future maintenance needs. Similar to the NYCTA and TTC projects, LU sees data integration and analysis as an important step in system optimization. “We want the data in a single deliverable that can be handed off to the maintainer,” Vickerstaff said.
The first step to conducting any of these higher-level analyses is asset management: “You can’t optimize; you can’t measure cost without knowing what your assets are doing,” Vickerstaff said.
Asset Management
Asset management provides the framework for optimization for systems of any size. The Utah Transit Authority light rail is a fraction the size of the NYCTA, for example, but their asset management strategies have a lot in common.
“Asset management is about knowing how and when to fix things before they fail,” said Paul Edwards, Senior Program Manager, Utah Transit Authority. Like many transit systems, the UTA has to contend with budget limitations that make labor-intensive programs hard to implement. “When I started [at UTA] we had technology, not people,” he said. So in order to streamline things, the UTA developed a digitally-based system for various inspectors and maintenance personnel that fed data directly into an integrated database and asset management system. “We cut out the middle men and we got rid of paper,” Edwards said.
By moving away from siloed databases and streamlining data collection and storage, the UTA was able to better correlate data across the system and, thus, better prioritize maintenance needs based on risk parameters.
In addition to streamlining asset data collection and storage, the UTA also began RFID tagging individual vehicle components. Currently, 27 different components on every car are automatically scanned whenever it enters the yard. This higher level of data granularity allowed maintenance and planning programs to track component life with a high level of specificity. “We’ve found that we cannibalize a lot of equipment, and that you can’t track the life of the vehicle and components just by the chassis life,” Edwards said. The ability to track individual components as they move through the system has also allowed the UTA to plan for staggered vehicle overhauls by categorizing vehicles based on average component life, he added.
The Optram asset management system that the UTA uses has a lot of opportunity for evolution, particularly because it is the same system that was recently procured by the NYCTA. “It will be very interesting to see how [the system] can be applied to the biggest transit line in North America. Whatever refinements are made there will come back to benefit us.” Edwards said.
Design / Build, Inherit / Remediate
Designing a rail transit system from the ground up provides a great opportunity to engineer a system whose every component is optimized with regard to the whole. It doesn’t always work out that way, but it can. The recent Design / Build / Operate / Maintain (DBOM) project to extend the Regional Transport District (RTD) Denver light-rail line to the airport is an example of a project that benefits from the hard-won knowledge of wheel/rail interface optimization. Part of the impetus for designing the system to exacting standards is the 29-year operate / maintain concession period, said Randal Duty, Chief Engineer, Denver Transit Partners. During this period, the system will be measured on on-time performance, station availability and compliant car-miles. A number of other factors further stress the importance of getting it right the first time. “We have a lump-sum 29-year budget for renewals so we absolutely have to make our budget work,” Duty said. These strict budget limitations and strict maintenance window limitations make system optimization more than just a theoretical exercise.
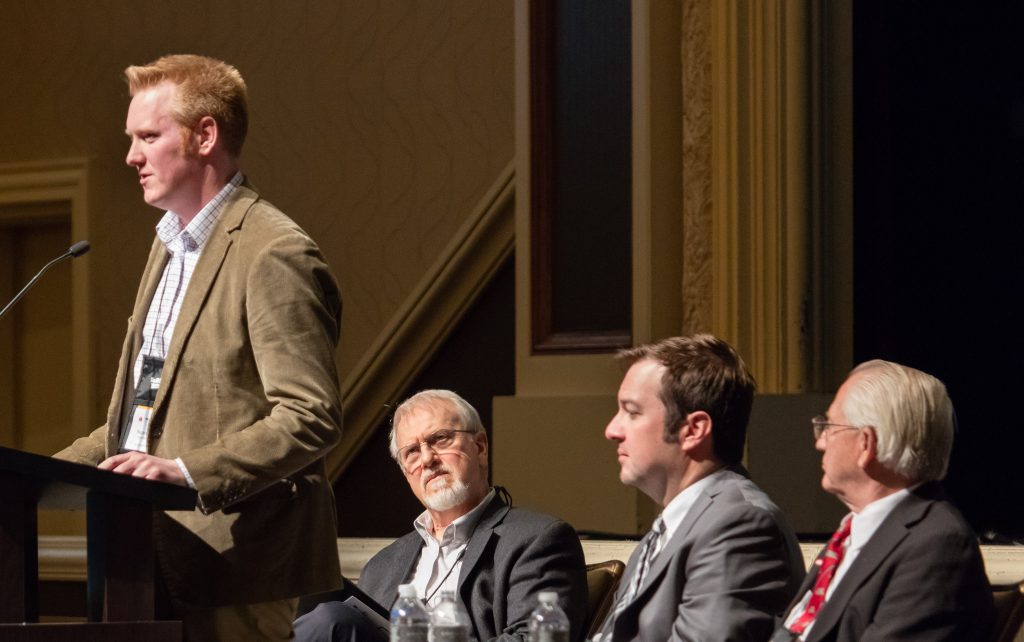
Panel discussion featuring Andy Vickerstaff, Senior Wheel Rail Interface Engineer, London Underground. Bob Tuzik, Rangecam Business Manager at Holland LP, and Publisher of Interface Journal (panel moderator). Randal Duty, Chief Engineer, Denver Transit Partners. Wyman Jones, Director of Rail Operations, Strategic Planning and Engineering, LA Metro.
As part of the planning phase for the line extension, the Transportation Technology Center Inc. (TTCI) analyzed the system and route characteristics to determine an optimum wheel and rail profile. As soon as the rail itself was laid and before revenue service began, DTP performed initial grinding to remove mill-scale and ensure profile compliance. “Given our budget limitations, it’s important to get ahead of the game with preventive maintenance,” Duty said. The line extension is still in its early days of operation, but it’s clear that a thorough design/build phase makes the next phase a lot smoother.
Things don’t always go smoothly, however. Due to a number of unorthodox original design decisions, the Bay Area Rapid Transit (BART) system has had to do a lot of costly maintenance over the years. The most notable design quirk is the system’s use of a cylindrical rather than tapered wheel design. Other peculiarities include low maximum car weight, steel tires mounted on aluminum wheels, broad gauge, and non-standard tie spacing.
During the design phase, it was thought that the cylindrical wheel profile would achieve high ride stability and comfort at relatively high speeds in tangent track. Cylindrical wheels, however, have no inherent steering capability in curves or self-centering mechanism. As a result, wheels steer by flange contact; and in tangent track, wheelsets tend to lock into one rail and remain in constant 2-point contact. The operating conditions have led to significant systemic corrugation issues. “Historically, our rail grinding program only had time to chase down corrugation and noise complaints,” said Greg Shivy, Principal Track Engineer, Bay Area Rapid Transit.
As part of the ongoing efforts to improve the system, BART is currently in the process of a complete fleet replacement that will include a transition to a more standard tapered wheel profile. As part of the vehicle acquisition and wheel profile design, Bombardier worked with BART to develop a modified-taper design that both alleviated many of the issues associated with the cylindrical wheel, and was compatible with BART’s existing special trackwork.
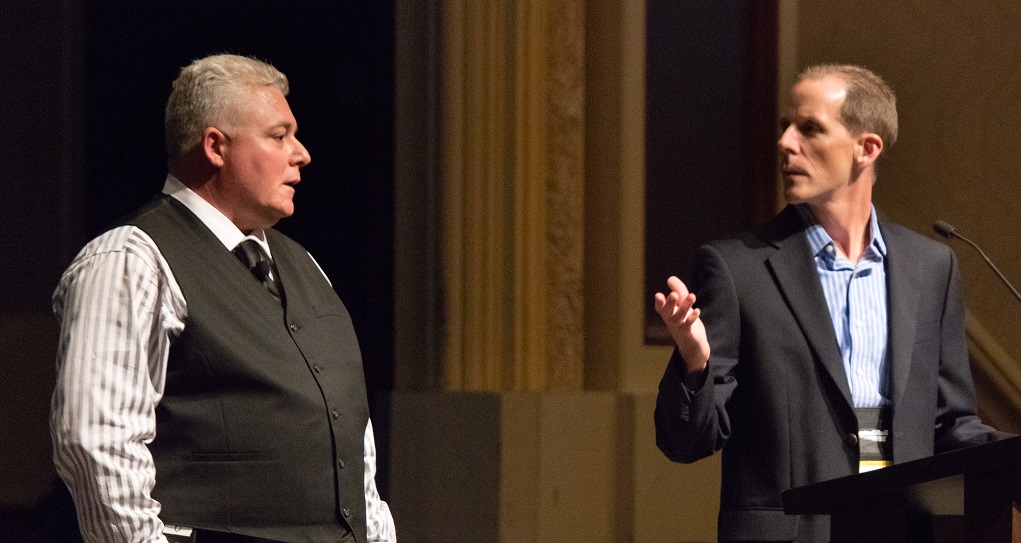
Greg Shivy, Principal Track Engineer at Bay Area Rapid Transit and Ben Holland, Manager of Vehicle Systems Engineering at Bay Area Rapid Transit.
The first pilot car with the new wheel profile is now on the property, said Ben Holland, Manager of Vehicle Systems Engineering. “It’s a big difference. It’s whisper-quiet,” he added. On-site tests have also confirmed that the new car operates at lower L/Vs across the board, compared to the old cars. The new wheel profile will finally allow BART to move out of the reactive maintenance mode of chasing down critical areas, and into a more proactive mode. “It’s going to save us a lot of money in both wheel and rail maintenance,” Holland said.
The LA Metro has also historically struggled to overcome a sub-optimal design/build phase that resulted in a number of systemic challenges. “We were given a system in which no one had talked to each other during the design phase. The cars were incompatible with the track and the wheels were incompatible with the rail,” said Wyman Jones, Director of Rail Operations, Strategic Planning and Engineering, LA Metro.
In the early days of its operation, wheels were going to scrap after only 19,000 miles of operation. One of the first remedial steps taken was to increase the hardness of the wheels, but this only served to transfer wear to the rail, causing heavy wear in curves. It was an attempt to treat the symptoms, Jones said.
After returning to a lower hardness wheel, the LA Metro installed stick-based friction modifiers. “Our wear was so drastic that we installed friction modifier cassettes on every single wheel,” Jones said. But even this only brought wheel life up 75,000 miles – far short of optimal. The next step the LA Metro took was to implement a custom wheel profile. It was a step in the right direction.
But the wheel is only half of the wheel/rail system. The real breakthrough came with the development of a matched wheel/rail solution, Jones said. “Until then, we had tried many times to fix one or the other and that didn’t work.” Wheel life is now 500,000 miles-plus. The optimized wheel/rail profiles performed better than expected. Previously severe hunting was virtually eliminated in tangent track, and curving performance was so good that the wheel flanges started to rust, Jones said.
Drastic steps like wheel and rail re-profiling aren’t always necessary to fix issues that were missed in the design phase. The remediation work done on the JFK AirTrain is a case in point. Noticing a precipitous drop in bogie life and high wear at frogs, JFK brought in Bombardier Transportation to investigate the root cause. The investigation determined that the high-conicity wheel profile in use was not compatible with the installed frog design.
“It’s obviously not economically sound or optimal to continually do weld repairs on all your frogs,” said Harry Skoblenick, Senior Expert, Structural Mechanics, Bombardier Transportation. One option on the table was to replace the existing frogs with conformal frogs, which match the frog point and wing surfaces in order to eliminate vertical impact stress. But refitting the entire line was a very costly proposition. Instead, Bombardier looked into the viability of modifying the existing frogs to match the AirTrain wheel profile. The modification involved adding material to the frog and then planing the surface to achieve profile conformity. Bombardier instrumented several frogs with strain-gauges and compared the modified frogs to new conformal frogs. They found equivalent baseline performance at a fraction of the price, Skoblenick said. Nearly all of the frogs on the main line at JFK have now been modified, and the results are already paying dividends – frog wear is down drastically and bogie-replacement has been put on hold, Skoblenick said.
Many rail systems have to overcome various legacy design quirks or missteps. Some have a more daunting task than others. The London Underground, which opened in 1863, is something of a legacy system. “We’re running a Victorian system that has to move 4.2 million people a day,” Andy Vickerstaff said. One of the unique challenges of the LU system is that it was built directly beneath the streets, and thus follows the curvature of the streets. As a result, the deep tube (inner-city) sections of LU are characterized by very tight radius curvature. That, combined with the lack of ventilation required for conventional rail grinding operations, makes rail maintenance particularly tricky.
In order to work around these restrictions, LU developed a “linear grinding” technique for deep tube track. Rather than grinding sections of track in order to restore full profiles with multiple passes, the grinder makes one pass per night, covering the same section of track several times over several nights, Vickerstaff said.
LU also has to contend with 95-lb bullhead rail. As of 2015, roughly 70% of the bullhead rail has been replaced, but it is expected to take another 15 years to replace the rest. One of the challenges of updating and modernizing the system is that new wheel profiles have to be compatible with these worn legacy rails.
Whether a system was designed 15 or 150 years ago, the crucial decisions made during the planning and construction phases set the stage for the long-term health of the system. Of course, no system is perfect, and every system is subject to degradation; wear and damage mechanisms always have to be actively managed. Over the years, the industry has come to embrace a proactive, systems-approach to wheel/rail interface management. If the experiences presented at WRI 2016 are any indication, it seems that much of the effort moving forward is focused on streamlining the process.
![]()
Jeff Tuzik is Managing Editor of Interface Journal.
All photos courtesy of Jack Lindquist.


