Rail Transit 2018: Quantifying Wheel/Rail Interaction and Managing Noise and Vibration
By Bob Tuzik
For three years running, New York City Transit and the Federal Transit Administration have kicked off the annual Wheel/Rail Interaction – Rail Transit conference with discussion of the NYCT/FTA research project to explore integrated wheel/rail analytics on MTA-NYCT’s No. 7 Flushing Line. It’s a fitting start to a conference that is devoted to wheel/rail, vehicle/track interaction in that the NYCT/FTA project touches on the myriad of design, operation, maintenance, measurement and analysis issues that rail transit systems around the world face, all in one place — the busiest transit system in the world. For the WRI 2018 Rail Transit conference, the talk was of what’s been learned through the project, thus far. (For background on the project, see WRI 2016 – Transit: Integration, Correlation, Remediation and “Ride this experiment,” Trains, October 2017, Vol.77, Issue 10.)
Data for the NYCT/FTA integrated analytics project has been generated by a plethora of automated measurement devices including wayside systems to measure wheel profiles, lateral and vertical forces and truck performance. On-board instrumentation, including two instrumented wheelsets, accelerometers, acoustic, vibration and power consumption monitors were mounted on a revenue train consist, (called the Data Collection Consist, or DCC) to collect data on the entire track through multiple runs during regular service on the Flushing Line on a daily basis.
With each measurement system generating its own output, a warehouse of data has been collected over the course of the two-year project. While some of the individual data streams were effective in identifying specific vehicle- and/or track- performance issues that warranted further scrutiny, finding exceptions or incidental vehicle- or track-related anomalies was not the project’s mission.
“The analytics from each instrument are valuable in their own right,’ said Eric Magel, Principle Engineer at the National Research Council of Canada, a partner in the project. “But a clear goal of this project at the outset was to determine what additional leverage and synergies could be captured by looking at all the data streams together.”
While the data is still being crunched for the final report to the NYCT/FTA, Magel presented examples of what the data collection and analysis has found.
By collecting wheel profile data from every wheelset several times a month, NYCT has been able to trend flange wear, tread wear and wheel diameter since the KLD Labs’ WheelScan system was installed as part of the project in April of 2017. At one point (about a year ago), NYCT noticed that unusual, shallower back of flange wear was appearing on one side of the trainset. While they didn’t know it then, the information was important. Subsequent investigation indicated that the shallower back-of-flange angle likely contributed to a pair of derailments at which the back-of-flange climbed the restraining rail at a turnout on the line.
As a result, the project team members devised a value associated with the back-of-flange measurements to identify angles that were shallow enough to pose a derailment risk. Since the number of wheelsets meeting that value represented only about 2 percent of the fleet, it was not a major concern. Continuous monitoring, however, showed the wear tailing off, then spiking again, which led investigators to conclude that a lubrication failure at the restraining rail had generated the type of high wear and high friction conditions that can increase derailment potential.
“That’s an example of one of the types of things that you can find by having access to this sort of data,” Magel said.
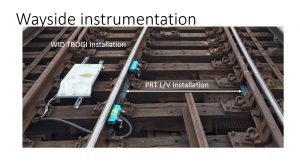
NYCT has also been able to use multiple data sets to identify or corroborate potential problems, or outliers in the data. It was able to use data from the L/V system, which is installed in mainline track about 300 feet from Wayside Inspection Devices’ TBOGI system (see Figure 1), which measures angle of attack and tracking position to determine whether the trucks have properly rotated after coming onto tangent track after exiting a curve. Using data from both wheelsets within a truck, WID calculates parameters such as tracking error, rotation and interaxle misalignment. By correlating data from both systems, the group identified a poorly performing truck within the test consist. The data further reflected that the wheels in trucks exhibiting interaxle misalignment and higher L/Vs in curves tend to wear at a higher rate.
Another area of interest identified in the project is energy consumption. The DCC is able to measure the amount of energy consumed while negotiating a specific segment of track. In one instance, NYCT measured the energy consumed in a curve with heavily corrugated rail before and after grinding. By integrating energy consumption with other data, NYCT was able to determine that the cost of corrugation in terms of energy consumption was about 5 percent. The NYCT expects to be able to use energy consumption data to assess the effectiveness of lubrication and friction management programs as they are introduced.
Acoustic data, along with accelerometer data collected on the DCC, are also being used to identify the location, severity and recurrence of rail corrugation. In one instance, a band of vibration at 280 Hz provided an indication of corrugation. “If you take 280 Hz at 29 miles an hour, you get a 1.8-inch wavelength”, Magel said. Inspection of the track confirmed corrugation at approximately 1.8-inch wavelengths at the location identified in the data.
The ability to quantify the severity of corrugation from a vehicle operating in revenue service is good in and of itself. But ongoing collection and analysis of the data will also allow NYCT to determine, then forecast how long it takes for corrugation to redevelop without the need for manual inspection and to quantify the impact of mitigation techniques, such as friction management, to curtail its development.
Another of the deliverables for the project was to use the instrumented wheelsets to identify the 10 most significant “hot spots” on the system. The NRC spent a lot of time pouring over the instrumented wheelset data. One of the hotspots it identified was a turnout near Willets Point, which is near the east end of the Flushing Line. In one instance, a six-fold increase in lateral forces was identified from one month to the next. “We didn’t know what it was, but we knew that something happened there,” Magel said. It turns out that a guardrail had been replaced. And since there was no wear on the new components, the flangeway clearance had been reduced, leading to heavier back-of-flange wheel contact and a dramatic increase in lateral forces.
While not part of the NYCT/FTA “integrated wheel/rail analytics” project, NYCT took advantage of the instrumentation in place and the data being collected to supplement other data collected to examine the effect of guard rail configuration on forces, noise and wheel/rail wear. That study focused on two primary areas:
1) standards set for the nominal flangeway between guard and running rails, lubrication conditions and practices, and the role of truck curving and wheel wear associated with derailments in guarded curves.
2) wayside measurements (L/V and TBOGI) along with multibody dynamics modeling of guarded and unguarded curves to determine future guard rail policies.
The task was to use service data on truck behavior from the available instrumentation to support Simpack modeling of the wheelset/guardrail interaction under both current operating conditions and alternate configurations and friction scenarios.
While referred to as “guard rails,” the guard rails at NYCT are used more like restraining rails, in that they are designed to bear some of the lateral load coming from the wheelsets and reduce the amount of loading on the outside rail. This is done to reduce wear rates on the high rail and reduce the potential for wheel climb.
Five sites were instrumented, two without restraining rail and three with restraining rail, including Willets Point, where two derailments had occurred within 24 hours last year. Instrumentation included L/V measurements on the running rails. On the sites with restraining rail, the restraining rails were strain gauged as well. A portable TBOGI system captured angle of attack and the tracking position of every wheelset that passed the site.
Among the primary observations is that speed has a strong effect on L/Vs. The lower the speed (measured from zero to 36 mph), the higher the L/Vs. On the unrestrained curves, the L/V values were typically in the 0.45 range, but had a significantly higher peak. Excessive wheel-flange wear and high gauge-face and top-of-rail wear rates are associated with the unrestrained curves. “We know that there’s quite a bit of corrugation and noise there as well,” Magel said. High L/Vs coupled with a shallow initial flange angle can present the potential for wheel climb, something that the NYCT is currently working to remediate.
The restrained curves represent two different scenarios. At Hunters Point a long curve is equipped with restraining rail throughout and is at a worn-in condition. The design 2-in. flangeway gap was 2.4 ins. due to wear at the time of the test. Willets point represents a brand new condition with a new guard rail installed to protect a number 6 turnout. The flangeway gap at Willets Point is 1-3/4 ins., a common gap to prevent batter of the frog point in turnouts.
Measurements showed a maximum lateral load of 10.8 Kips on the guardrail at Hunters Point. Due in part to the narrower flangeway, zero cant (associated with a turnout), and the fact that there was new, unworn restraining rail throughout, the peak lateral force at Willets Point was nearly double that at Hunters Point. While these forces are likely to contribute to greater wear and the potential for wheel climb on the Willets Point restraining rail, the requirement for a 1-3/4-in. gap across from the frog limits options. Lubrication of the guard rail would clearly reduce restraining rail climb and has since been implemented by NYCT. A taller guard rail would further reduce risk. Additional modeling is being considered to more specifically identify the contributions of back-of-wheel flange wear, vertical track dynamics, speed profile and other parameters on restraining rail climb.
Reinventing a System
The San Francisco Bay Area Rapid Transit (BART) is in the process of cutting over from the use of a cylindrical wheel profile, which it has operated since the system’s inception in 1972, to a tapered wheel profile in conjunction with the design and delivery of a new fleet of railcars. In preparation for the introduction of the new cars, BART has begun implementing new, redesigned rail profiles. The complementary wheel and rail profiles are expected to reduce wear rates and extend material lives, and reduce wheel/rail noise, which is a significant issue on the system.
The problem with cylindrical wheels is that they rely on the flanges to steer. This causes premature flange and gauge-face wear, and promotes rail corrugation and noise, which can be corrected only by grinding. Flange contact is such that wheels are re-trued or replaced for wheel / flange thickness (related to heavy gauge-face contact). Side wear is such that BART has never seen a high flange “It’s never happened,” said Charles Franz, BART’s Vehicle Systems Engineer – Rolling Stock & Shops. “We don’t even look for it.”
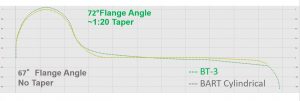
With the development of the new fleet and wheel design, BART took the opportunity to revisit the design of the wheel/rail interface. Bombardier, the vehicle manufacturer, devised the new BT-3 tapered wheel design (Figure 2). Where the cylindrical wheel had zero taper and a 67-degree flange angle, the BT-3 wheel has a 1:20 taper and a 72-degree flange angle, and a slightly greater flange height. L/V ratios associated with the new profile are 50% less than the cylindrical wheel. BART expects reduced wear, slower corrugation growth, less noise and less flange wear, leading to less overall metal loss during re-truing cycles.
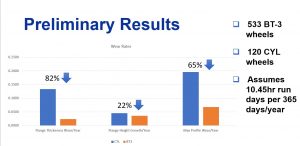
BART has been changing to the new BT-3 wheel at a rate of 11 cars per week and expects to have all converted by year end. To date, BART has seen improvements associated with the BT-3 wheel profile, including an annualized 82% reduction in flange thickness wear, 22% reduction in flange height growth, and a 65% reduction in overall maximum profile wear (Figure 3).
“Ultimately, we plan to get into preventative maintenance for our wheels,” Franz said.
The most notable aspect of the track design at BART is its 5-1/2-foot gauge. Track design on the 110-mile system (a 10-mile extension is under construction) includes 45% at-grade ballasted-tie track, 28% aerial structures with direct fixation and 27% subway with direct fixation, including a 13-mile trans-bay tunnel between Oakland and San Francisco. Maximum curvature on the system is 500-foot radius.
BART worked with the NRC to develop a family of four new rail profiles to match the new wheel profiles, as well as a group of interim profiles to be used during the break-in period.
“Grinding is going to be the key to longevity here,” said Gregory Shivy, BART’s Principal Track Engineer – Maintenance & Engineering. BART plans to grind in the new rail profiles over four to six years. “We’re already starting to notice a difference, and we should start seeing a big difference as more wheels with the BT-3 profile are implemented,” he said.
BART is currently addressing corrugation based on noised complaints at more than 400 locations on the system. “Our goal is to get into a preventative grinding mode instead of chasing corrugation,” Shivy said.
Toward that end, BART is working with Advanced Rail Management (ARM) to guide its grinding program, which is currently done with two in-house 12-stone machines. Shivy expects BART to complete 4000 pass miles or more over the next five to six years. To complement the grinding effort, BART and ARM are also taking pre- and post-grind eddy current and corrugation measurements with a Corrugation Analyzer Trolley (CAT) to determine the effectiveness of the grind.
“We’re learning a lot,” Shivy said. “It’s reassuring to know that we’ve gotten rid of some of the really heavy RCF that we’ve had on the system.”
BART has also established an aggressive rail relay program, replacing old, standard strength steel per year with higher hardness rail. The plan is to replace about 12 miles of rail per year over the next 10 years.
The good news for BART riders and area residents is that through these efforts and work that BART has been doing with ATS Consulting to monitor and mitigate wheel/rail noise, decibel levels in areas in which corrugation has been addressed have dropped from 94dB to 74dB.
Noise & Vibration
Wheel/rail noise and vibration was a known potential issue at Sound Transit from the outset. To address concerns, the track design incorporated a direct fixation system, using e-clips on the high-resilience, Cologne egg-shaped fasteners, which provide up to a 10-dB reduction in noise and vibration. While the system provided the expected attenuation, another issue arose. Evidence of clip breakage appeared within six months of opening the ULink section of the line, an extremely noise and vibration sensitive portion of the system because of its proximity to the University of Washington research facilities.
E-clips were failing at a rate of about a dozen per month. “We could understand one or two clips failing per month, but 12 to 13 was concerning,” said Shankar Rajaram, Noise and Vibration Program Manager at Sound Transit.
One of the early explanations for the premature fatigue failure was that the clips might have been weakened from overdriving during the installation, thus initiating a weak spot for crack initiation. The list of potential causes for this premature clip breaks later expanded to:
— design and quality control factors related to the clips and fasteners
— conformance of track construction to design and construction tolerances,
— higher than anticipated dynamic forces from the light rail vehicles at the clip break areas
— potential return current leakage resulting in accelerated corrosion.
Although it was apparent that the mode of failure was due to fatigue, it wasn’t clear what was causing it, especially since the clip failures were concentrated in a few areas, while there were no clip failures in other areas with similar track design and operating conditions.
Aware of the noise-related assessment work that was being done at BART, Sound Transit decided to take a close look at noise and vibration conditions. Consultants took noise readings and instrumented the clips and fasteners to quantify the noise/vibration levels at the fasteners. Sound Transit was able to determine that the noise on the system was coming from the track at a frequency of 890 Hz, which it found corresponded to the natural frequency of the e-clips.
“It appeared that resonance of the track system was likely subjecting the clips to strains that exceed their design limit,” Rajaram said. Working with Pandrol and acoustic consultants, Sound Transit determined that the use of larger clip would shift the frequency to above this 900 Hertz and out of the track resonance. There were no failures within a 3,000-foot section over nine months. “That was good news, Rajaram said, but it did not address the root cause.”
Sound Transit strain gauged the track to determine whether track geometry or poor-performing trucks generated a coincidence effect that might contribute energy into the system and the 800- to 900-Hz resonance that appeared to cause the e-clip failure.
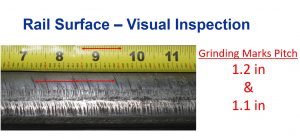
Coincident to this effort, Sound Transit was proactively trying to improve the finish quality of its grinding program. CAT data that ATS had collected at BART showed a typical 30-mm (1.18-inch) peak in the rail roughness wavelength. Research done in Australia indicated that this 30-mm peak was related to the typical 3600 rpm speed of the grinding motors on rail grinders. A visual inspection of the track at Sound Transit led to an “aha!” moment, when inspectors identified grinding marks at 1.1- to 1.2-inch intervals wherever a clip failure had occurred (see Figure 4).
“It’s not completely proven, but it appears that under train traffic, the deeper grinding marks at 30-mm intervals can input enough energy into the system to push the e-clip beyond its design limit.
As a result of its efforts, Sound Transit is moving toward fixing the root cause of the problem. For its next grinding contract, it is specifying the ISO 2095: 2005 grinding specification, which has more stringent requirements for the final surface finish than the EN 13231-3:2012 specification, which North American grinders typically work to.
“To understand how to mitigate noise, you have to understand the root causes,” said Briony Croft, principal engineer at Acoustics, SLR Consulting (Canada) Ltd. The combined roughness of the wheels and rails directly affects the overall noise level. Higher roughness increases the noise from both vehicles and track. The other factor is speed. “Rolling noise is proportional to speed,” she said. “The faster you go, the more noise you get.”
The European standard for roughness measurement, which is related to the generation of rolling noise, provides an idea of where the roughness of the system is, relative to targets for acoustic roughness, Croft said. “There’s no standard that says rail should be at this level, but it’s a goal that would represent rail in excellent condition acoustically.”
The ISO goal shows that acoustic roughness targets, particularly for the very short wavelengths, are much more stringent than the regular maintenance grinding specifications. “If we’re looking in the 10- to 30-millimeter wavelength range it’s a factor of five more stringent,” she said. As you move out to longer wavelengths they become more equal. So, if you can change your grinding strategy to shift the roughness wavelengths to longer wavelengths, it’s going to be better for noise, as well.
Most grinders in North America aim for the EN specification for maintenance grinding. “If you want to grind to an acoustic target it’s going to be much more difficult to achieve,” she said. “It’s going to require more time on track because you need to achieve a much more polished surface.”
There are examples of transit systems that have introduced more stringent standards for grinding for noise reasons. Transport for New South Wales requires a tighter specification in areas that are close to houses; it’s more relaxed in areas further from the track.
Richard Stock, milling technology manager for LINMAG Rail Services, reviewed the performance of rail milling operations at Irish Rail, an option that may soon be available in North America. With its ability to make significantly deeper cuts than grinders are capable of, milling equipment can remove 100 percent of the corrugation, leaving no imprint on the rail surface to act as a starting point for new corrugation, Stock said.
“European specifications usually allow about 5 percent of the peak to peak values for different wavelengths. Milling machines can achieve results that are well below 1 percent of the peak-to-peak values to be outside of this corrugation. “With milling technology it’s possible to produce a perfectly smooth rail,” he said. By focusing on removing all of the damage from the rail, milling can provide a surface roughness at or below 5µm.
Regardless of the technology, North American rail transit systems are moving to the fore in innovation and the use of technology to monitor, analyze and manage wheel/rail interaction on their systems.

Bob Tuzik is Publisher and Editor-in-Chief of Interface Journal.
All photos courtesy of Jack Lindquist.


