
Fuel Savings and Wear Reduction: A Case for Locomotive Wheel Flange Lubrication
by Jeff Tuzik

The benefits of friction management are well known and often touted. But one benefit in particular—fuel savings—receives far less attention than the others. But as railroads race to meet greenhouse gas reduction targets and ultimately net-zero goals that they have set for themselves, fuel savings have become more than just a cost-saving measure. And the energy-saving properties of friction management are in a position to take on increased significance.
“For most railroads, diesel fuel is their single largest purchase expense. It’s a prime target for cost-cutting,” Wayne Kennedy, Principle of Kennedy Consulting, told delegates at the 2025 Wheel/Rail Interaction Heavy Haul Conference.
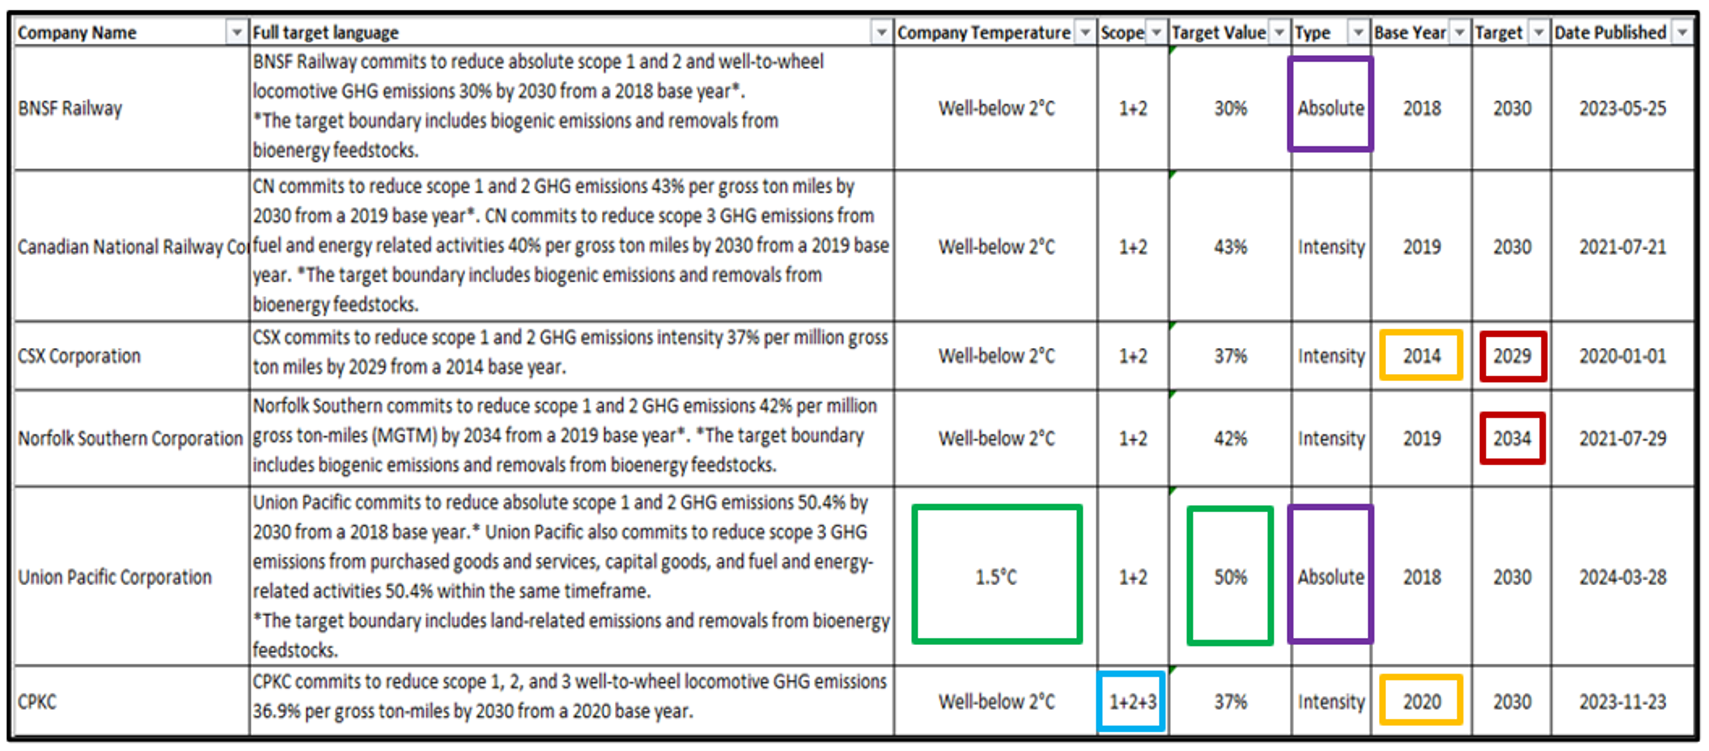
North American class 1 railroads have worked with the Science Based Targets initiative (SBTi), an organization that helps companies take validated, science-based actions to curb their carbon footprints, to develop plans to reduce greenhouse gas (GHG) emissions, Kennedy said. Many of these goals are ambitious. (Figure 1 details the SBTi goals set by each of the class 1s.) Generally, they are based on reducing GHG emission, and align with an overarching aim of promoting a ≤2-degree (Celsius) reduction in global temperature rise (it’s worth noting that the SBTi has recently updated their target to a ≤1.5-degree reduction).
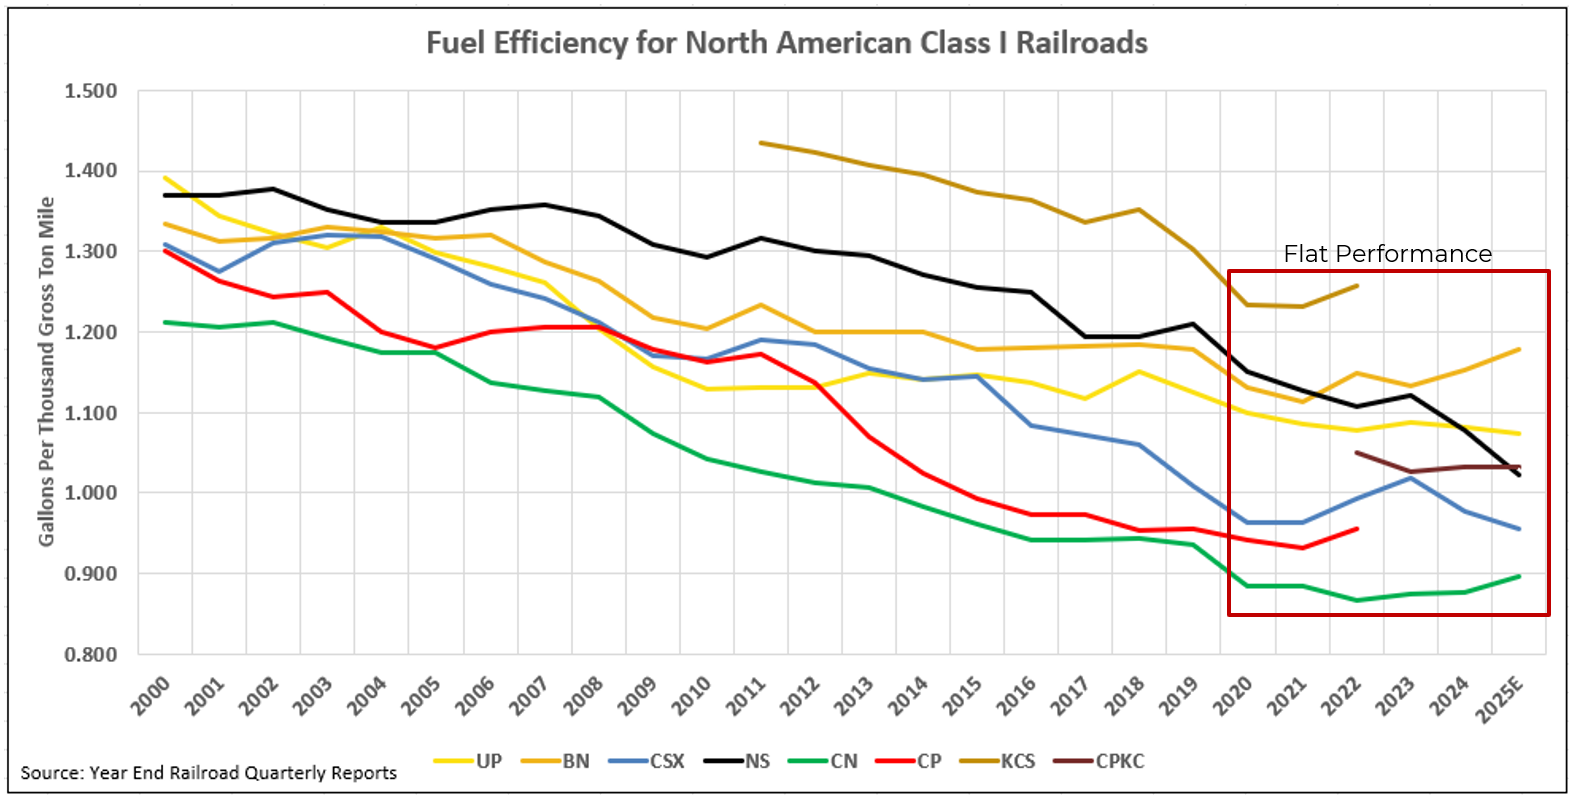
“For class 1s, locomotive emissions account for 85 to 95 percent of their emissions,” Kennedy said. Luckily, (thanks to a number of technological and operational improvements) from both a climate and an economic perspective, fuel efficiency for class 1s has steadily improved since 2000. However, this improvement has flattened since 2020 for all railroads except Norfolk Southern, he said. (See Figure 2 for details.) “The SBTi goals are not fuel efficiency goals per se, but if they were, the 2030 goals set by the class 1s would be impossible to achieve at the current rate of improvement.”
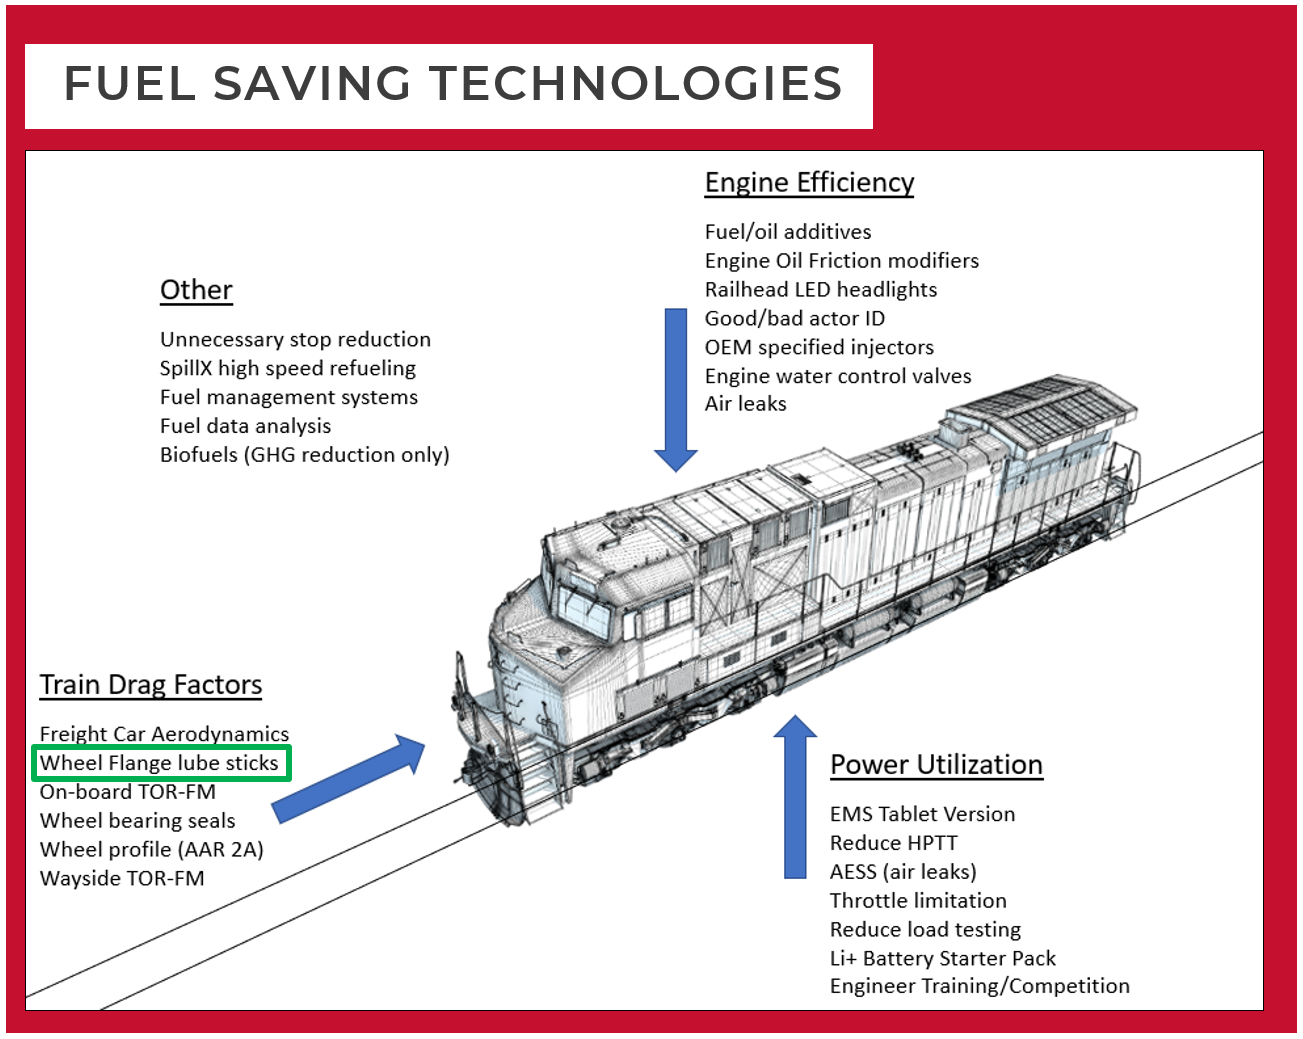
That said, fuel efficiency is important, regardless of the impetus for it. And there are many fuel-saving technologies readily available (see Figure 3). But these technologies have very low levels of adoption, Kennedy said. “Many of these technologies (alone) generate fuel savings in the one to three percent range. But,” he said, “the signal-to-noise ratio for fuel data is quite high.” This makes it difficult to prove that fuel-savings is attributable to a specific technology, rather than to a combination of factors. Still, among fuel-saving technologies, locomotive wheel-flange lubrication stands out as a cost-effective option for increasing fuel efficiency, he said.
Solid Stick Flange Lubrication
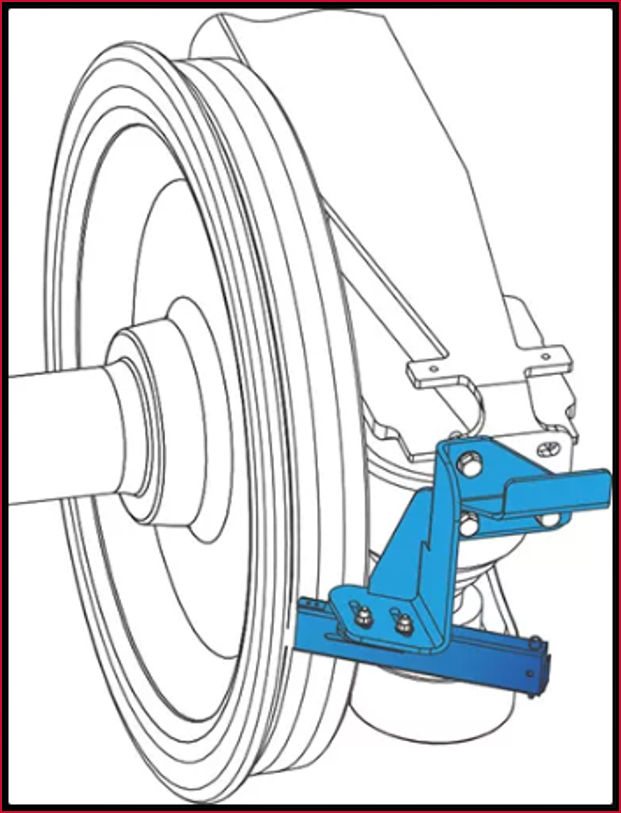
Solid-stick flange lubrication isn’t a new technology, “it’s been around for decades,” Kennedy said. It’s also a simple technology: a spring-loaded cartridge mounted on the bogie, near the wheel, pushes a solid lubricant stick (molybdenum disulfide is typically the active ingredient) against the flange throat of the wheel to provide a significant reduction in the coefficient of friction at the flange/gage-face interface. (Figure 4 shows a diagram of a typical configuration.) “It’s very effective at reducing the wear rate of wheel-flange height and thickness.”
“Proving fuel savings is not for the faint of heart,” Kennedy said. “It requires rigorous statistical analysis.” Fuel consumption is highly variable in general. It’s affected by factors such as:
- Train length
- Train weight
- Commodity (cargo) type
- Horsepower-per-trailing-ton (number of locomotives)
- Topography
- Train speed and aerodynamics
- Locomotive engineer skill/performance
- Locomotive condition
- Car and consist condition
- Track and ballast condition
- Episodic events
- Traffic/congestion
- Weather
- Location
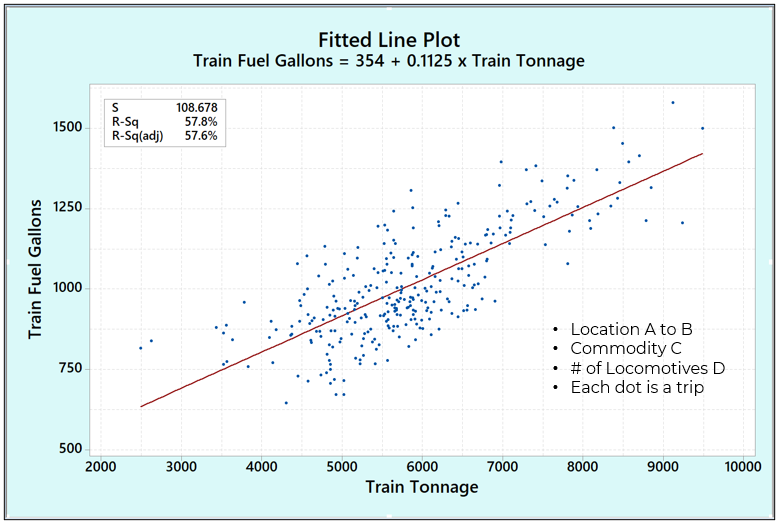
An exhaustive list. The natural question that arises is how to account for all these variables in an accurate, digestible analytical model. Figure 5 shows regressing tonnage against fuel: “segmenting the data to the point where you have several thousands of these regression plots allows you to determine a percentage fuel savings,” Kennedy said. However, depending on how much noise there is in the fuel data and what percentage of fuel savings is targeted, generating valid results will require a significant number of trips over a considerable span of time (figures that must themselves be statistically derived).
Applying these analytical methods to locomotive-mounted flange-stick testing, Kennedy developed a logistic-regression model using 500,000 trip segments over a period of one year. For this test, the dependent variables were fuel consumption in gallons per thousand gross ton miles (K/KGTM) and train velocity in mph. The independent variables were:
- Locomotive(s) equipped with solid stick flange lubrication (Y/N)
- Train commodity (cargo) group
- Horsepower-per-trailing-ton
- Train tonnage and length
- Distributed power (Y/N)
- Segment route miles
- Wind speed
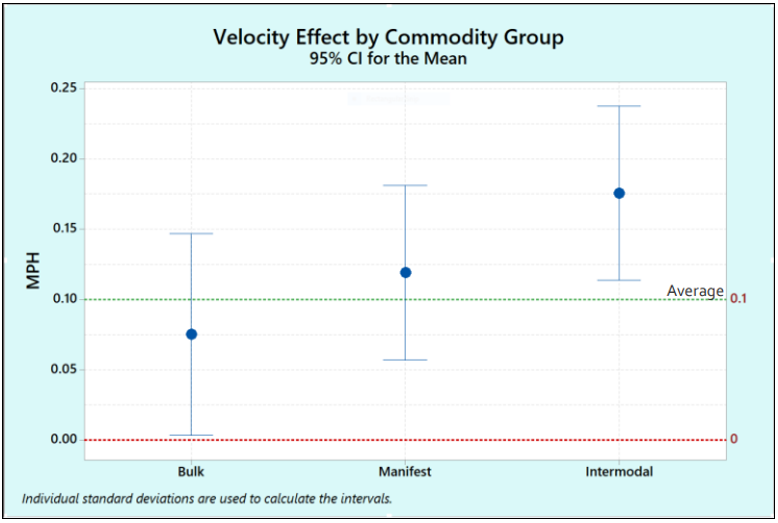
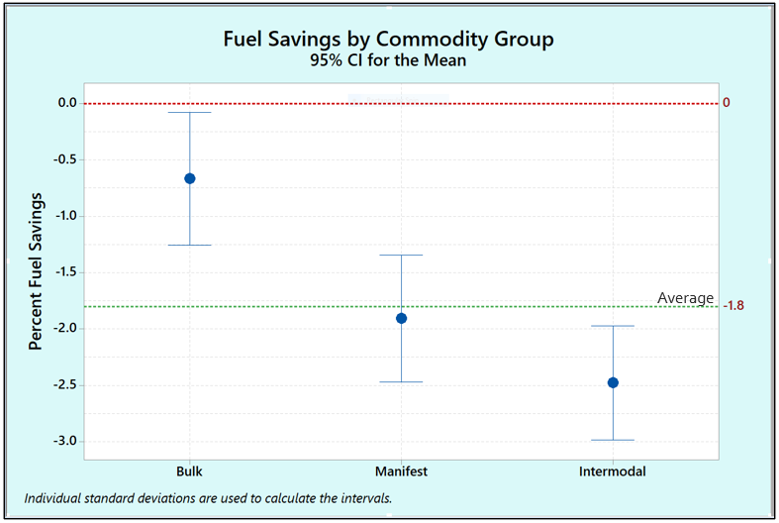
“We divided fuel savings by commodity group,” Kennedy said. As Figure 6 shows, bulk commodities showed the least savings, manifest showed moderate savings, and intermodal showed the greatest fuel savings, with the overall average for all commodity types at ≈2%. Figure 7 shows results for velocity effect by commodity type wherein the average is a 0.10-mph increase: “Not huge, but still meaningful,” he said. “And if you wanted to forgo fuel savings and simply focus on speed, that’s an operational choice you could make, as well.”
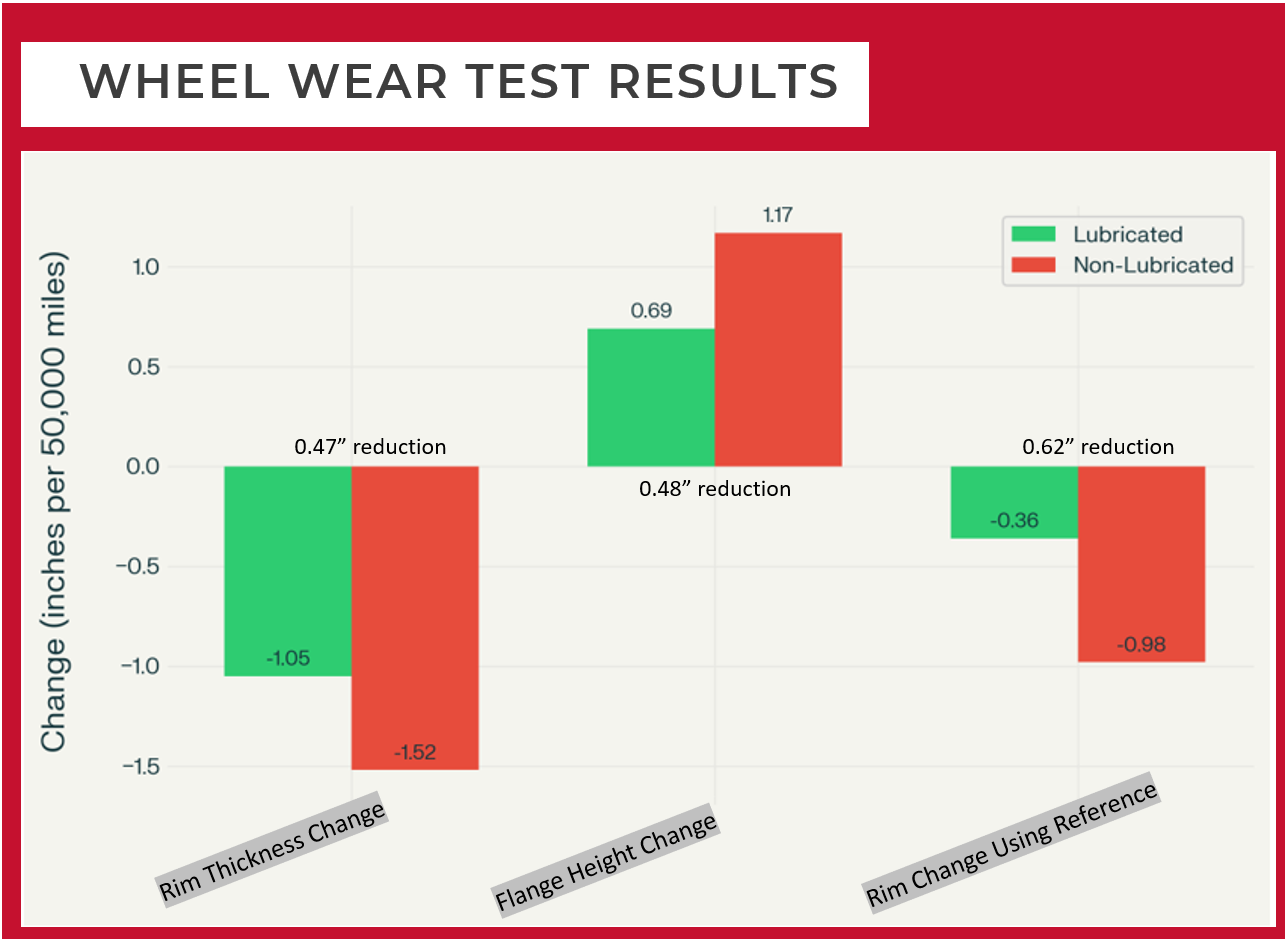
Naturally, there are also wheel-wear benefits associated with wheel-flange lubrication. Kennedy Consulting and First Analytics performed wheel-wear validation tests by comparing locomotives with and without solid-stick flange lubrication on the same heavy-haul coal route (and thus operating under the same conditions and with the same lading) over a period of six months. The test measured wheel-rim thickness, flange height, and tread-to-witness-groove distance (as a secondary/alternate measure of rim thickness). “The results were pretty impressive, even over the relatively short period of the test,” he said. Rim thickness in lubricated versus unlubricated wheels saw and 0.47-inch reduction, flange height saw and 0.48-inch reduction, and witness groove-to-flange distance saw a 0.62-inch reduction. (Figure 8 shows a detailed graph of this data.) “The data shows a clear trend toward decreased wear rates and an increase in overall wheel life.”
Fuel Savings Analytics
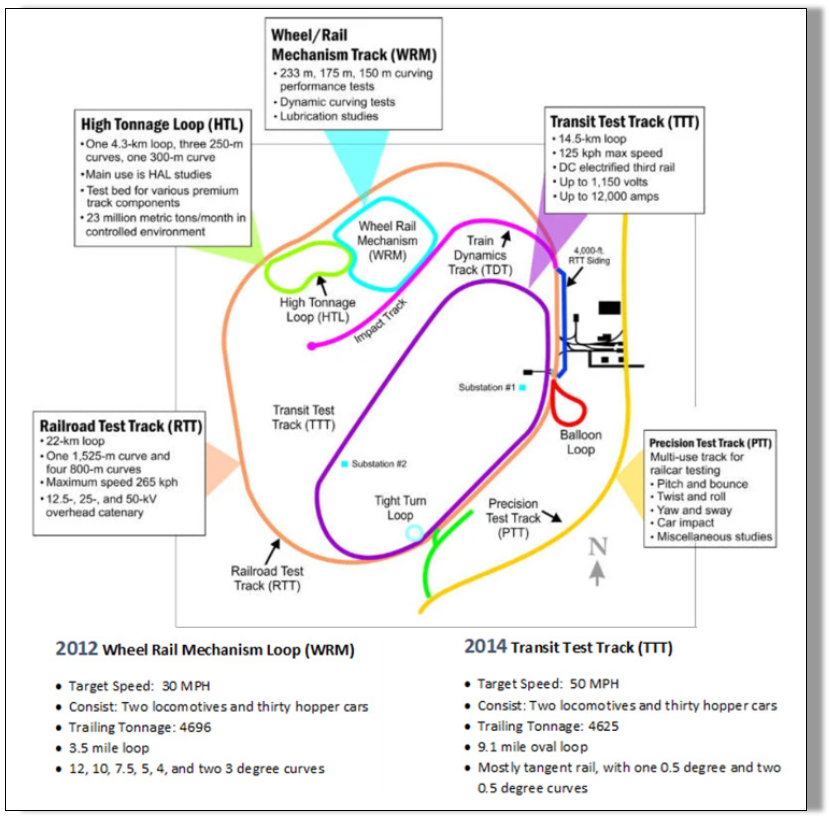
The detailed fuel savings analyses performed as part of the overall study were performed by the former TTCI at the Transportation Technology Center, specifically on the Wheel/Rail Mechanism (WRM) Loop and the Transit Test Track (TTT) Loop (details of these test loops are shown in Figure 9). “Often these types of tests are done during revenue service, but if you can eliminate variables and really focus on your area of interest, like you can at the test center, you can get quite rigorous statistical data,” said co-presenter Robert Stevens, Managing Partner at First Analytics. “As Wayne indicated, we’re looking for a very tiny effect [on fuel] in data that’s very noisy.” Some noise is understandable and explainable, but a good portion of it is inexplicable variability. This means that having confidence in the data is a significant statistical challenge, he said.

For the sake of statistical rigor, experiments like these are typically designed in a way that is analogous to a clinical trial: One group gets the “treatment” (solid-stick wheel-flange lubrication, in this case), while the control group receives the standard treatment or placebo (no wheel-flange lubrication). “We’re trying to eliminate bias up front, and minimize inherent variance,” Stevens said.
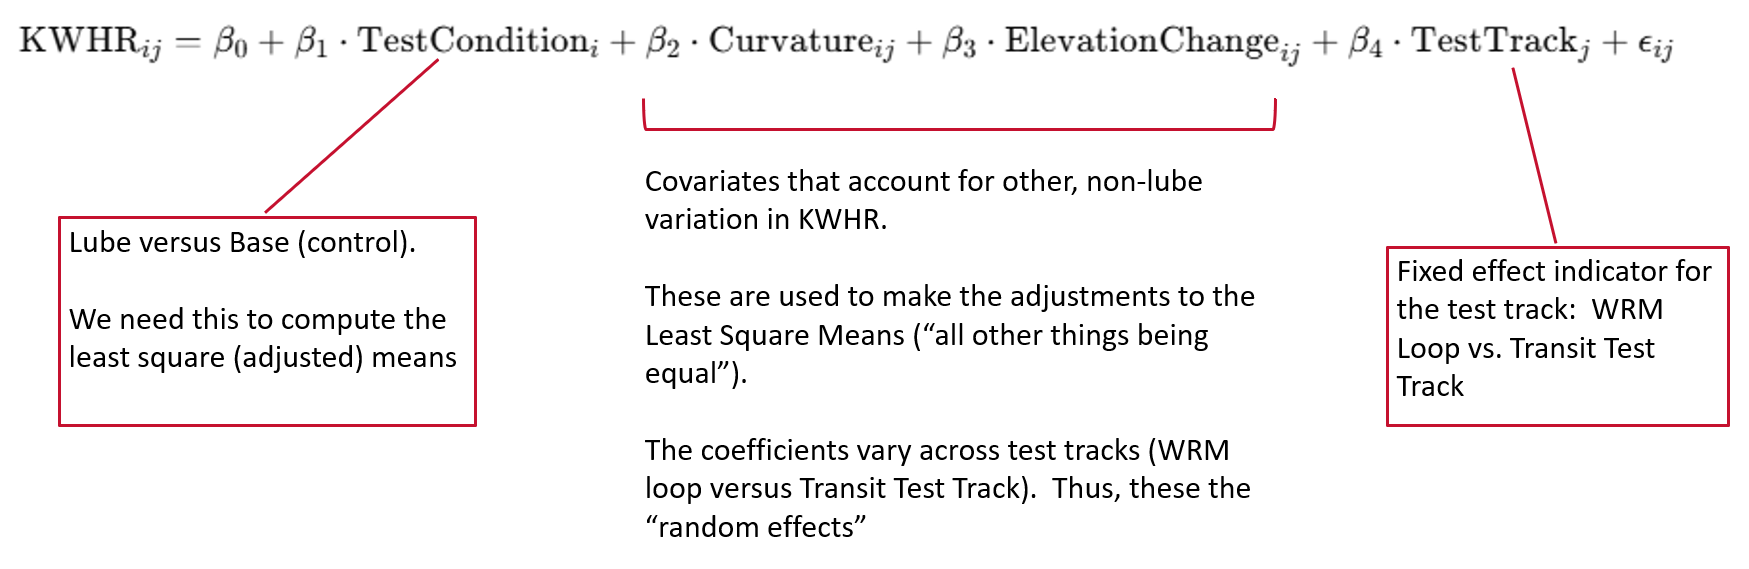
On the back end, data from these tests was analyzed using an ANCOVA (Analysis of Covariance) model (the details of which are shown in Figure 10). In simplified terms, energy usage in kilowatt-hours is a function of test conditions (lubrication vs no lubrication), covariates or variations from test to test that are unrelated to the test conditions but that effect energy usage, and on which test track (the WRM or the TTT) the run took place. ANCOVA results for these tests indicated a 3.2% reduction in energy consumption (KWHR per second) for the trains with flange-lubrication-equipped locomotives, he said.
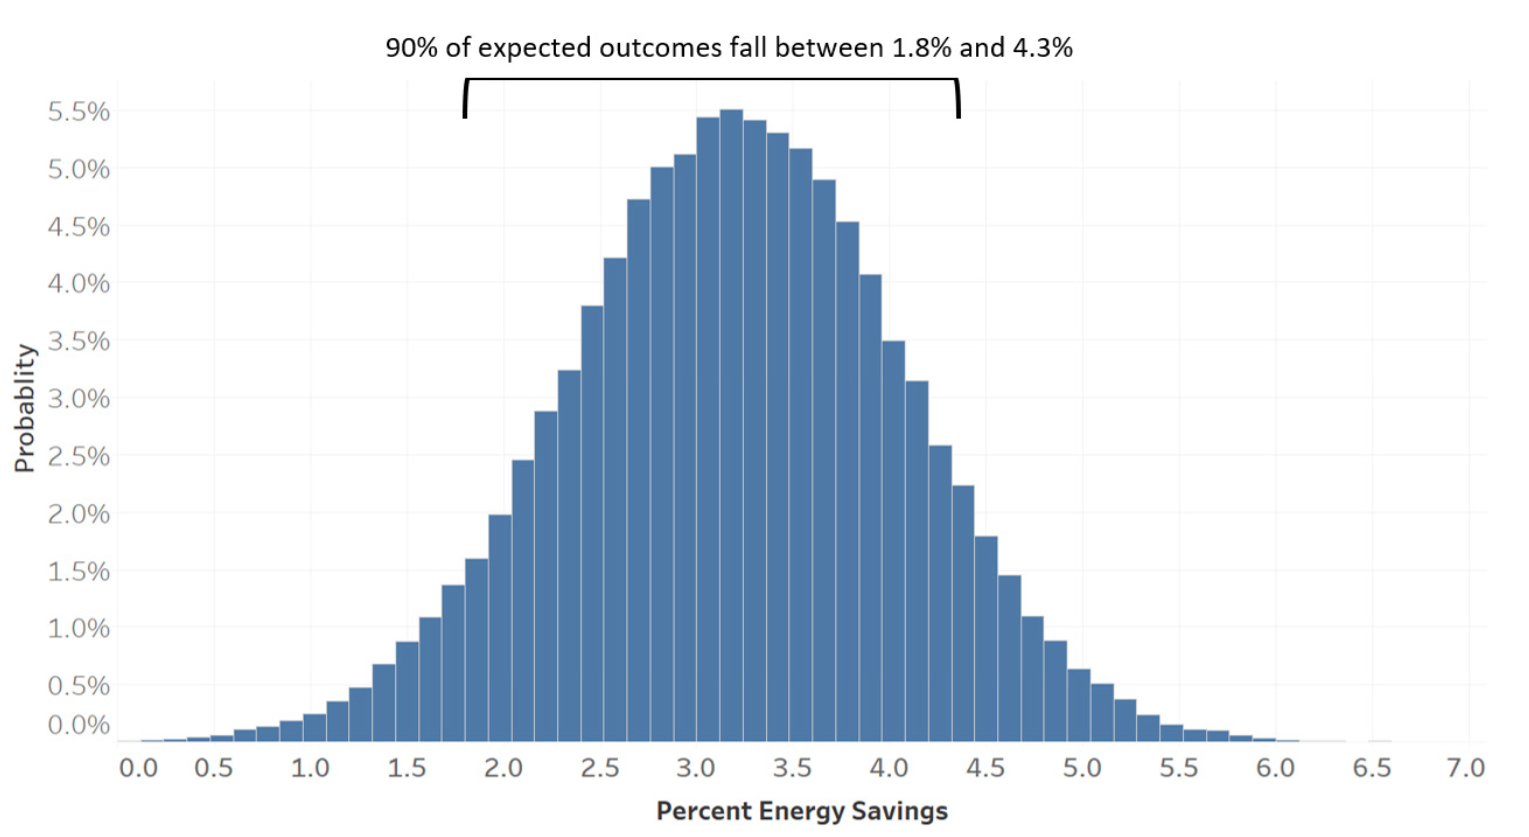
Monte Carlo analysis—which (in simplified terms) provides a range of potential outcomes and their probability of occurrence—applied to these analyses indicated that 90% of all expected outcomes fell between 1.8% and 4.3% energy savings (see Figure 11).
Kennedy Consulting and First Analytics also analyzed the effects of flange lubrication on parameters like locomotive throttle position and time spent in various throttle positions. “The analyses didn’t always agree on the magnitude of the effect, but they all agreed that flange lubrication has a demonstrable, positive effect on all parameters related to energy savings,” Kennedy said.
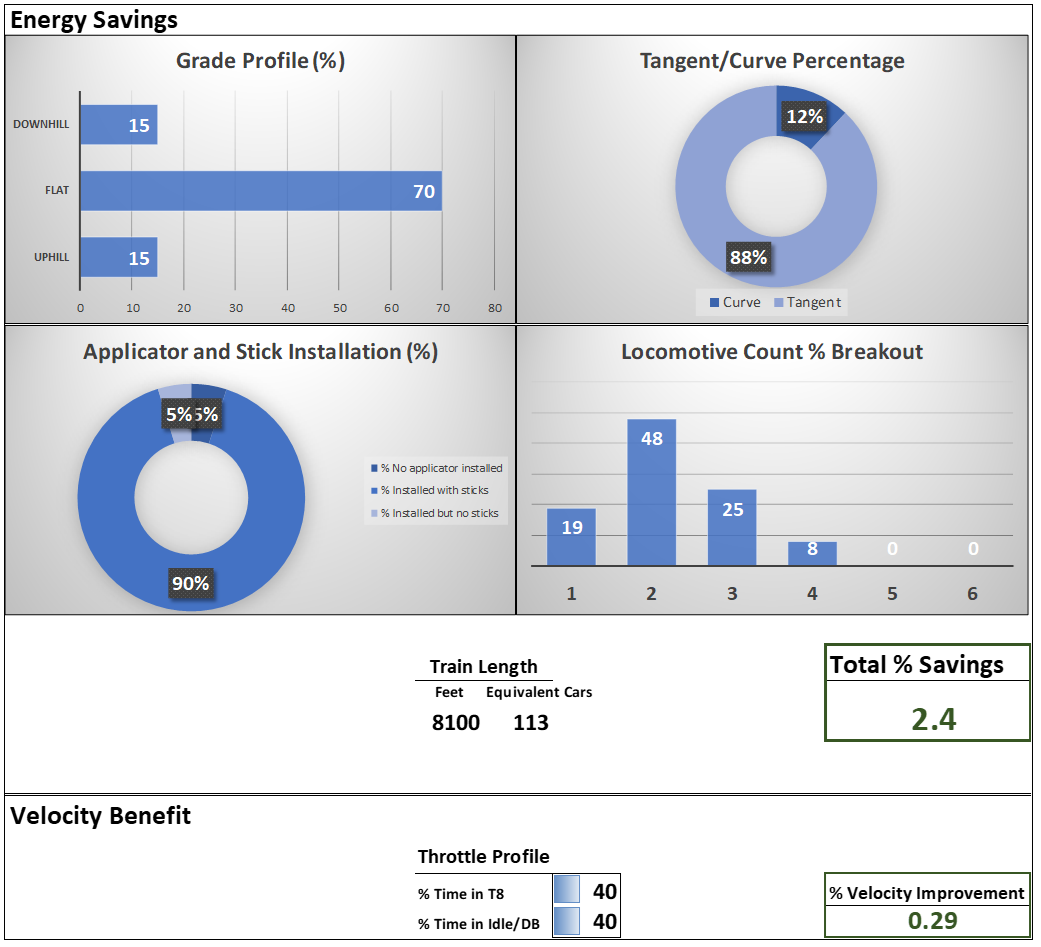
Extrapolating the results from the test track to class 1s in general is no easy task and involves some degree of assumption and indeed additional variance. Thus, Kennedy and Stevens developed a software tool wherein railroads can plug in parameters specific to their own systems in order to generate a predicted fuel savings (based on multiple parameters such as the number of lubrication applicators, number of locomotives, average horsepower-per-trailing-ton, etc.). A sample of this application’s output is show in Figure 12.
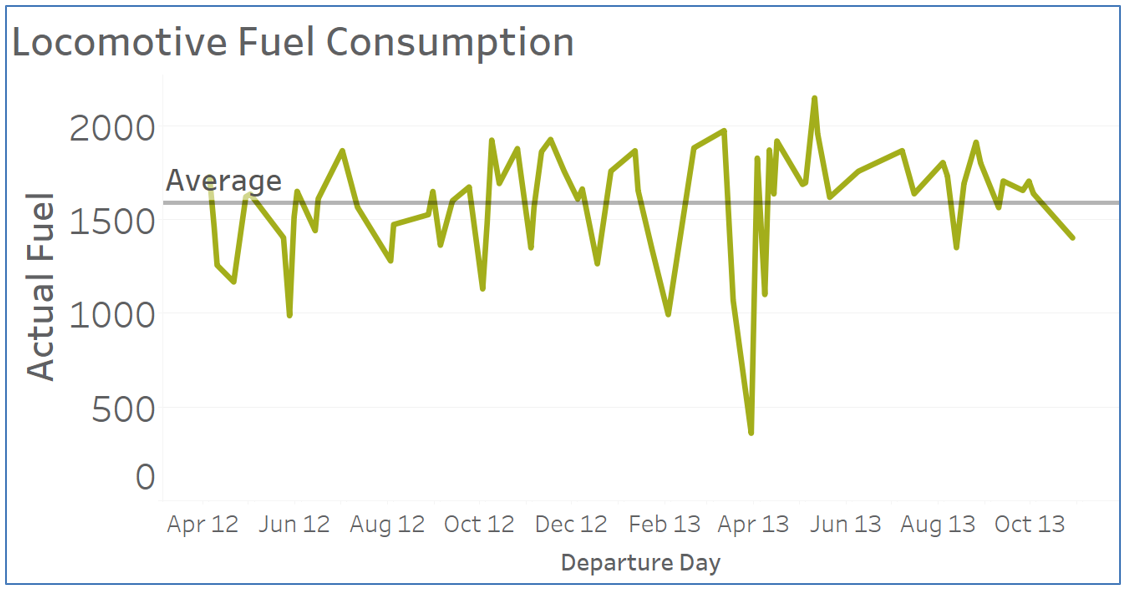
From a practical perspective, converting these energy savings to tangible fuel savings is difficult, Stevens said. Figure 13, for example, shows average fuel consumption over time for the same train consist, with the same driver, same origin and destination, and nearly the same tonnage and lading. Clearly, there is a tremendous amount of variability in the base data.
Nonetheless, extensive testing and analysis have shown a tangible, demonstrable energy/fuel savings as a direct result of locomotive wheel-flange lubrication. “Even aside from the savings in fuel costs, railroads need all the help they can get in meeting their SBTi GHG emission-reduction goals,” Kennedy said. And, relative to other technologies, solid-stick-wheel-flange lubrication is a simple and inexpensive technology that can help with this. In addition to these benefits, there are proven benefits to wheel/rail interaction and wheel wear associated with wheel-flange lubrication. With all the benefits, it’s something of a mystery as to why railroads haven’t adopted this technology en masse. Perhaps, as Kennedy said, it’s a matter of developing an even more rigorous statistical approach to proving fuel savings in the low (1% to 3%) range. Perhaps it’s a matter of finding a way away around departmental silos and the “who benefits, who pays?” mentality that often stems from them. Or maybe it’s about getting the word out.
Well, the word is out.

Jeff Tuzik is Managing Editor of Interface Journal
This article is based on a presentation made at the 2025 Wheel/Rail Interaction Heavy Haul Conference.
All images are courtesy of Wayne Kennedy and Robert Stevens except where otherwise noted.