
Designing and Monitoring a One-of-a-Kind Vibration-Mitigation Track Section on Seattle’s Sound Transit.
by Jeff Tuzik
Noise and vibration mitigation have been driving forces in the design and maintenance of Seattle’s Sound Transit light rail system. Controlling wheel/rail-generated noise experienced by riders and tenants living and working near the track is one challenge; transit agencies around the world must contend with it. Mitigating vibration is another. But the need to virtually eliminate vibration on the track beneath the University of Washington on Sound Transit’s 1 Line, is a very tall—if not the tallest—order in the industry. Here, noise and vibration from passing trains must be completely isolated from the highly sensitive scientific equipment and instrumentation in the university’s physics, engineering and nuclear research facilities. A daunting task, but one that Sound Transit and the University of Washington were willing to take on. The result is a section of track that is likely the most vibration-sensitive, and the most rigorously monitored (for vibration) section of track in North America, perhaps in the world.
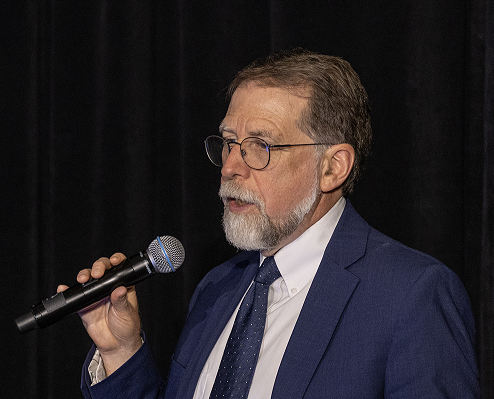
The Northgate Link Extension, which connects Sound Transit’s 1 Line from the University of Washington to the Northgate Neighborhood, kicked off in earnest in 2007, with the signing of a Master Implementation Agreement (MIA) between Sound Transit, The University of Washington, Washington State DOT, and King County Metro. Among the stipulations in the agreement was the development of, and adherence to, thresholds for vibration and magnetic field levels generated by the system where it passed beneath the University. The University further identified specific buildings that were or would be host to highly sensitive scientific equipment and processes. To tackle the difficult task of running trains underneath these sensitive labs, the main engineering consultant brought in Wilson Ihrig (now owned by RWDI). “The University has a lot of funding, including government funding, going to high-level research and experimentation, so they were rightly very protective of these sensitive sites,” Derek Watry, Technical Director of Wilson Ihrig / RWDI, told delegates at the 2025 Wheel/Rail Interaction Rail Transit conference.
In the early days of the project planning, the university didn’t know the precise thresholds to set for vibration levels. “They knew that everything [i.e. sensitive equipment and instruments] worked in its current state, and that they didn’t want to, or couldn’t, make significant changes on account of increased vibration levels.” But the section of track under the University didn’t just have to be designed and built to exacting vibration specifications, it would have to be maintained to that level, too; so, the MIA also required ongoing vibration and monitoring after revenue service began.
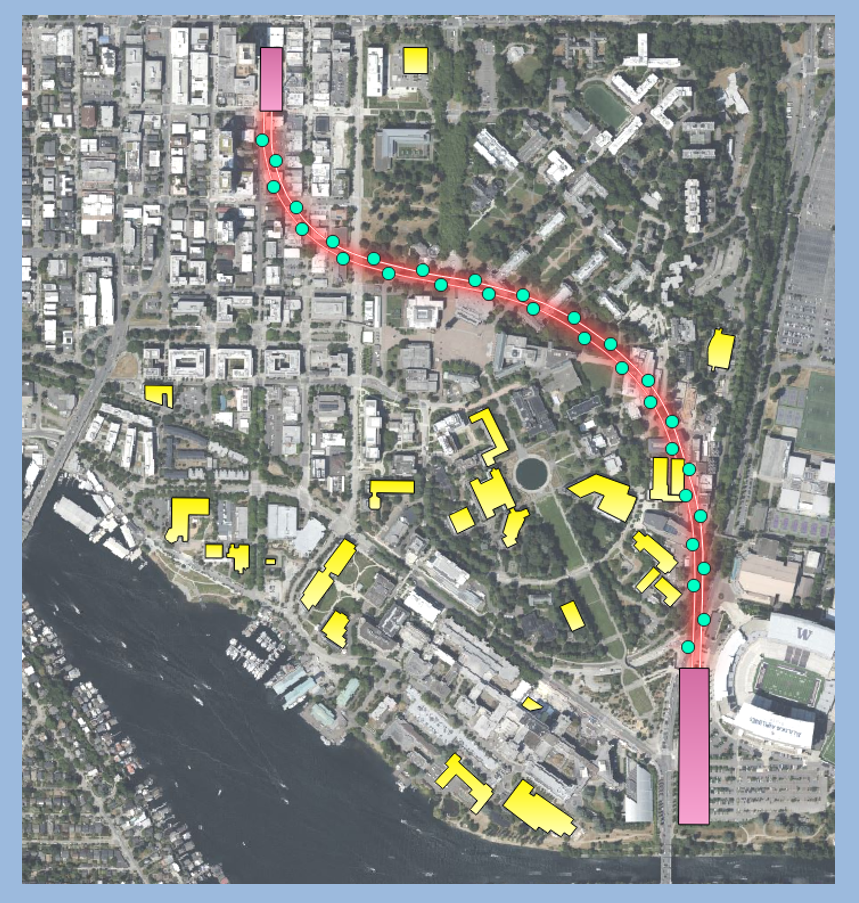
Figure 1 shows the path of the Northgate Link Extension beneath the campus (from University of Washington Station [bottom right] to University District Station [top left]) with sensitive buildings highlighted in yellow. The green dots represent pairs of vibration monitors (31 pairs in total) installed in the tunnel, roughly one train length apart.
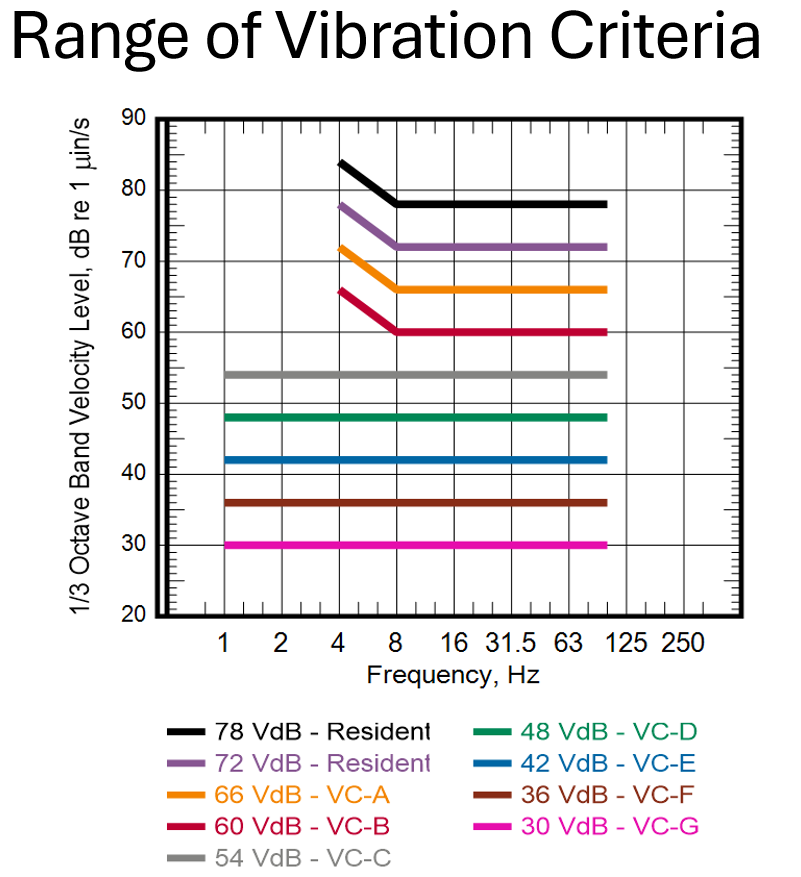
To help put vibration monitoring thresholds into perspective, Figure 2 shows a number of different vibration decibel (VdB) criteria. The top two lines mark FTA limits for daytime operation (black line) and for night (purple line). “For most transit agencies, the most ubiquitous “receptor” is a residential receptor at night; 72 decibels (the purple line) is what you’re aiming for,” Watry said. From the orange line down, each line shows a different vibration criterion (VC) curve. These are used to assess the effect of vibration on various vibration-sensitive instruments—orange (VC-A), for example, is used for instruments like bench-top microscopes, while blue (VC-E) is for very high precision processes like electron-beam lithography at nanometer scale, Watry said. The brown and pink lines (VC-F and VC-G), which are at 36 VdB and 30 VdB respectively, “are not recommended as design criteria and are typically only for evaluation purposes,” he said.
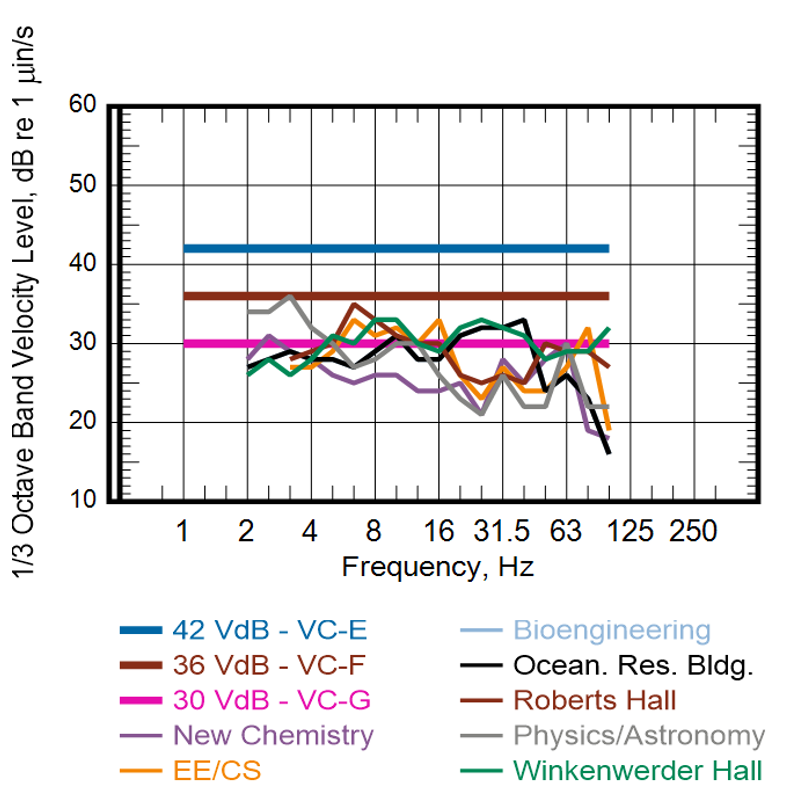
Figure 3 shows only the three most sensitive VC curves from Figure 2 (E, F, G) along with ambient vibration level data from seven of the 24 sensitive buildings on the UW campus (specifically, the seven buildings with the lowest ambient VdB levels). Clearly, many of these readings fall well below VC-G, or 30 VdB. “The university’s position was that although they didn’t need a threshold as low as VC-G at the time, they might need it in the future. So, VC-E, F, and G effectively became the design criteria,” Watry said. In effect, passing trains would have to generate so little vibration that they were undetectable over ambient levels at the sensitive sites.
“These are very challenging criteria. When the university first came to us, we had to tell them that we couldn’t guarantee it was even possible.” – Derek Watry
Design and Construction
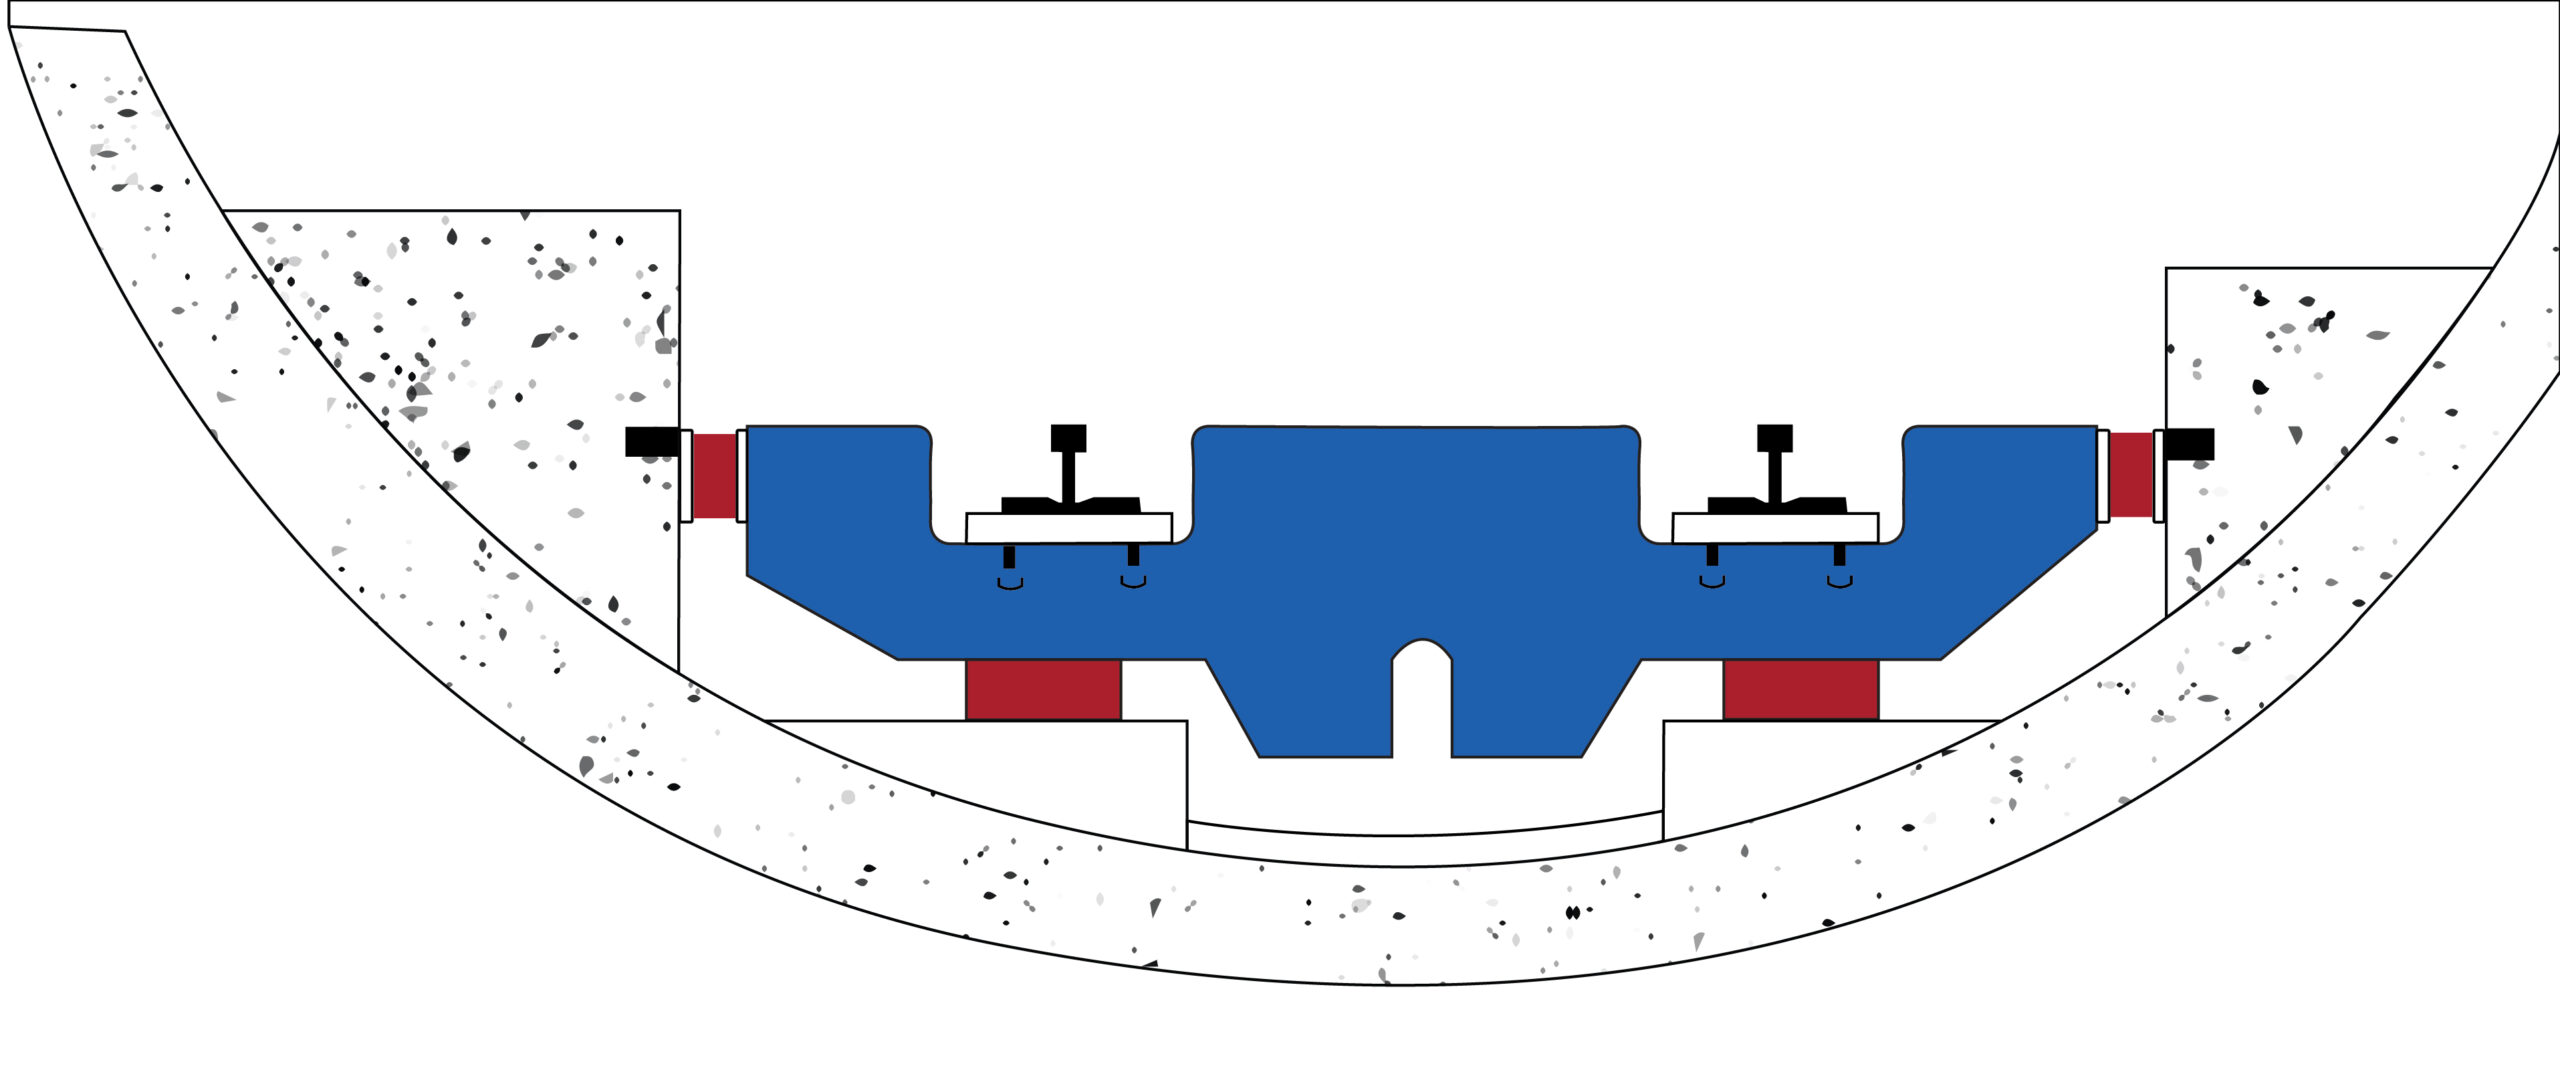
Clearly, achieving these stringent criteria was possible—the Northgate Link Extension has been in service for a decade now—but it wasn’t easy. The primary vibration-attenuating track structure is the 5 Hz floating slab designed by Wilson Ihrig’s Dr. James T. Nelson (see Figure 4). In the Figure, the blue-shaded section is the floating slab itself, while the burgundy areas are elastomeric pads, Watry said.
The floating slab is a vibration-isolation system that is tuned to a 5 Hz resonant frequency. This means that when the system is disturbed at the resonant frequency, there is a slight amplification—above that frequency the system provides attenuation; below that frequency, the system transmits vibration unattenuated. “As you go lower in resonant frequency, you get more attenuation at higher frequencies, so, you want to go low,” Watry said. “The problem is, you get very soft track; there’s a lot of deflection, a lot of rail strain, and potential concerns about ride quality. So, it has to be done very carefully.”
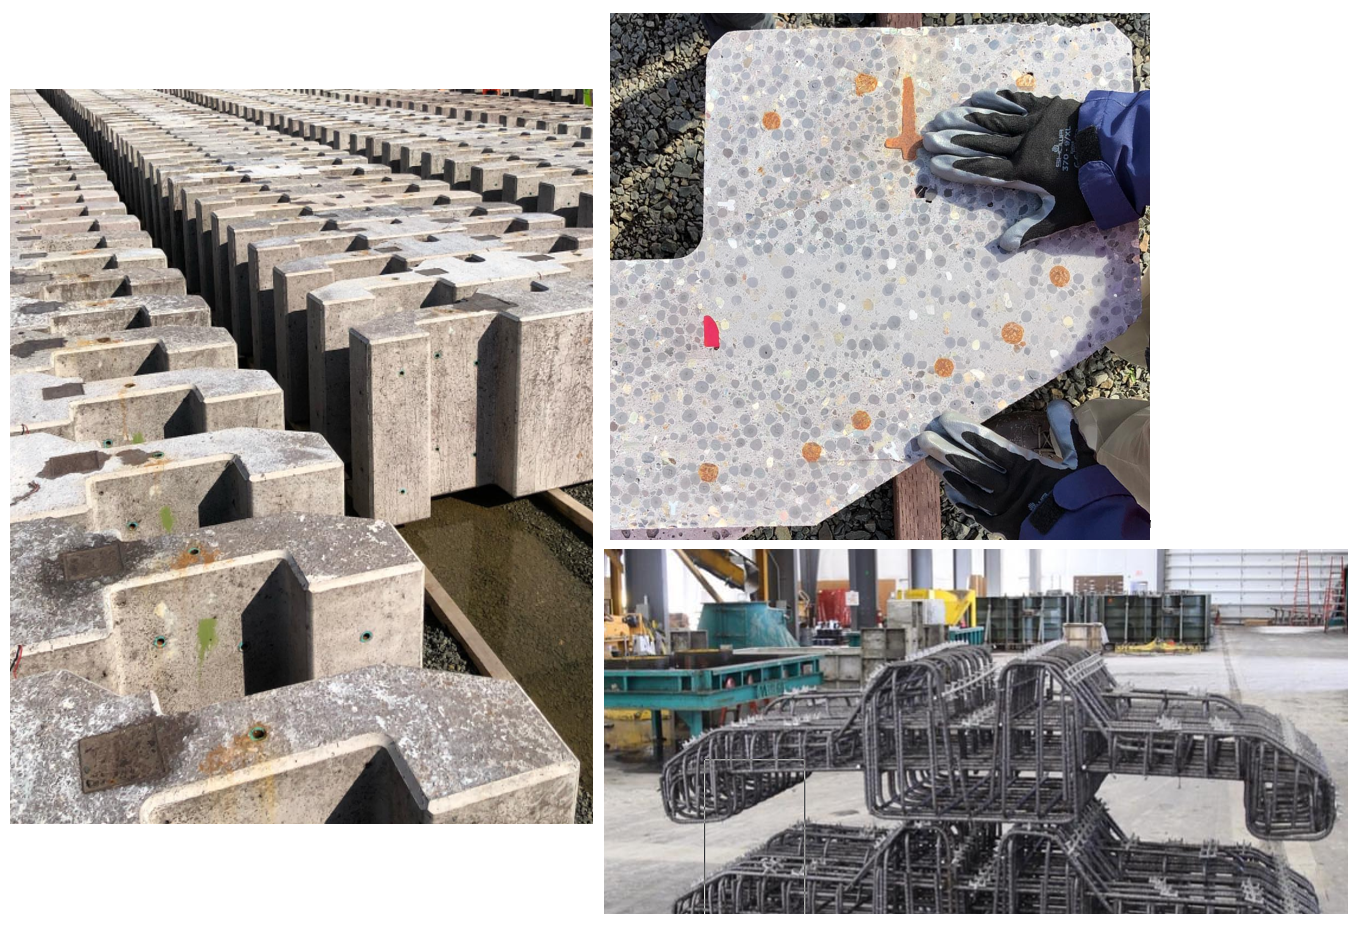
Figure 5 shows individual sections of the floating slab (individual slabs) at different stages of the casting process. The unorthodox shape of the slabs is the result of adding additional mass without impeding the function of the slab.
“You likely won’t see floating slab construction this complex anywhere else the world.” – Derek Watry
Although the 5-Hz slab does most of the heavy lifting, many additional factors contribute to vibration mitigation on this section of track, including:
- The use of ultra-straight rail (which is rolled to tight tolerances in order to mitigate long-wavelength undulations).
- Vehicle force density level (FDL) specifications: “FDL is an inherent measurement of how much vibration is generated by a particular vehicle running over a particular rail,” Watry said. Vehicle FDL measurements are particularly affected by axle, truck, and suspension design.
- Implementation of an ongoing preventive grinding program focused on rail surface roughness in addition to profile maintenance and RCF mitigation.
“We had to prove the efficacy of what we were doing every step of the way, because the University was very dubious about this whole idea,” Watry said. As a result, Wilson Ihrig and Sound Transit installed a prototype of the slab design in the tunnel at Seattle’s Capitol Hill area, years before construction began on the Northgate Link Extension. The prototype slab served as a test site and proving ground; measurements and data from this test site, taken by Sound Transit, Wilson Ihrig, and other third parties convinced the University to move forward with the design.
Monitoring Methods
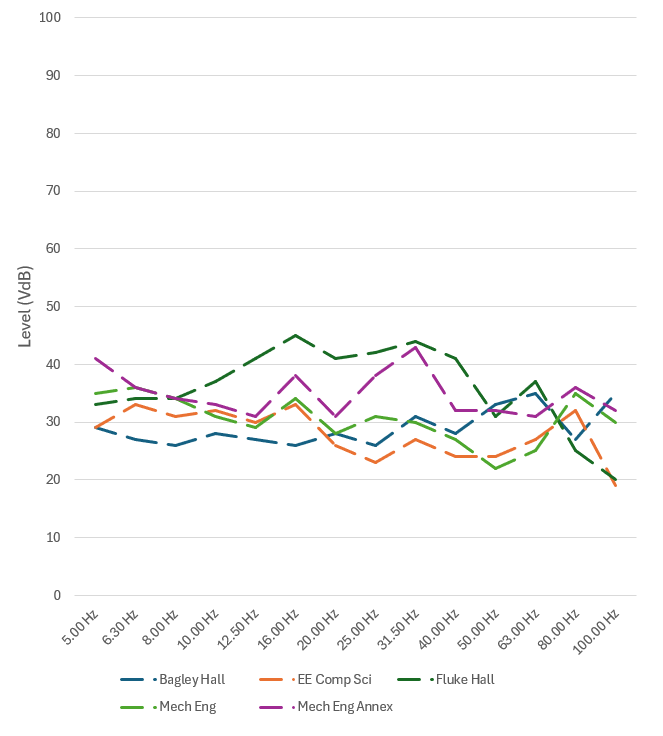
After the slab was built, and the Northgate Link Extension was opened in 2016, the monitoring phase of the project began. Each of the sensitive buildings on campus was (previously) measured, and each had their own bespoke vibration criterion curve, Watry said. Figure 6 shows examples from five buildings on campus. “It’s important to remember that by design you weren’t supposed to be able to measure any vibration from a passing train. The trains should be undetectable from the buildings,” he said. On top of this, measuring vibration at the buildings themselves was found to produce a large number of false positives and noise resulting from closing doors, footsteps, and other background vibrations.
As a result, Watry and his colleagues decided to move vibration monitoring to the tunnel itself. To facilitate this, they used a Vibration Adjustment Estimate (VAE) developed by ATS Consulting, which is an estimate of vibration reduction from the tunnel monitor(s) to each individual building, Watry said. This metric was based on vibration criteria at the monitors and the criteria (as previously measured) at the buildings. For example, going back to the building vibration criteria in Figure 6, the Mechanical Engineering Annex (the purple line) has a criterion of ≈30 VdB at 63 Hz, and the VAE, in this case, adjusts for ≈40 dB of vibration reduction. This means the measurement in the tunnel should be ≈70 VdB or lower, he said.
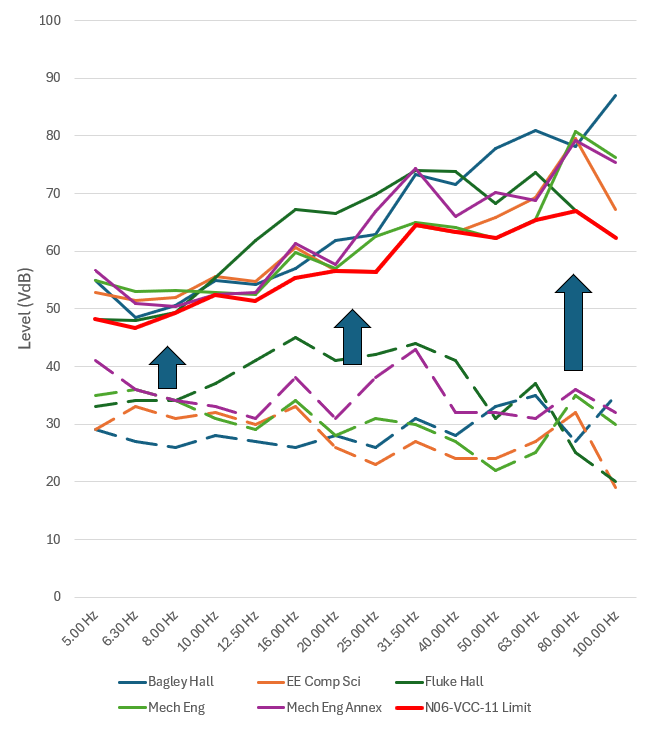
Each monitor and building pairing has its own VAE—given that there are 31 monitors and 24 sensitive buildings, and that each sensor had to be cross referenced with each building, and each building with each sensor, there are over 1,000 VAEs at play in determining how each sensor relates to each building, Watry said. Figure 7 shows the same building criteria as in Figure 6 (dotted lines) as well as in-tunnel criteria (solid lines). The red line marks the composite threshold for all buildings at a specific in-tunnel sensor, as calculated by the appropriate VAEs.
Monitoring Data
The track under the University is continuously monitored. Redundant pairs of geophones provide the actual measurements in 18 1/3-octave bands from 2 Hz to 100 Hz. The monitoring system provides vibration warning and exceedance alarms based on the VdB criteria and VAE-adjusted thresholds that Watry discussed, said Katie Krainc, Associate Consultant at Wilson Ihrig.
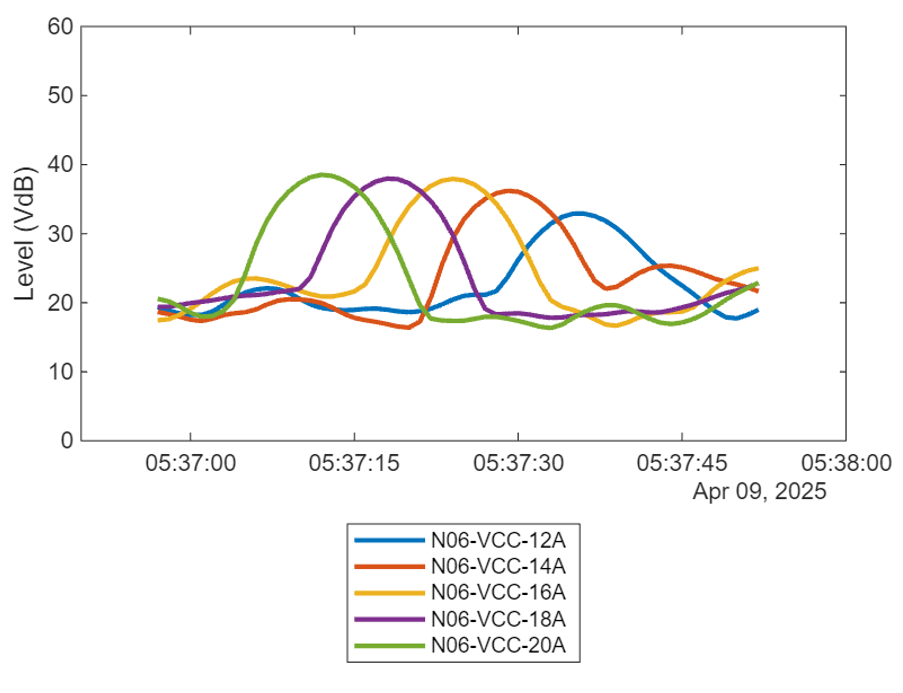
For each train that passes, each sensor pair collects the maximum VdB at each of the 18 measured 1/3-octave bands. The raw data looks considerably different to the processed VAE-adjusted data; Figure 8 shows the passage of one train as captured by multiple sensors (each sensor is a different color). In this case, the data shows VdB levels at 5 Hz. Daily traffic is between 120 and 130 trains, Krainc said, so the amount of raw data coming in is substantial, but manageable. “One issue we discovered early on was that seismic activity from the Cascadia Subduction Zone caused warning and exceedance alarms to go off. The University’s power plant was also responsible for some anomalous readings. So, we have to filter that noise out.”
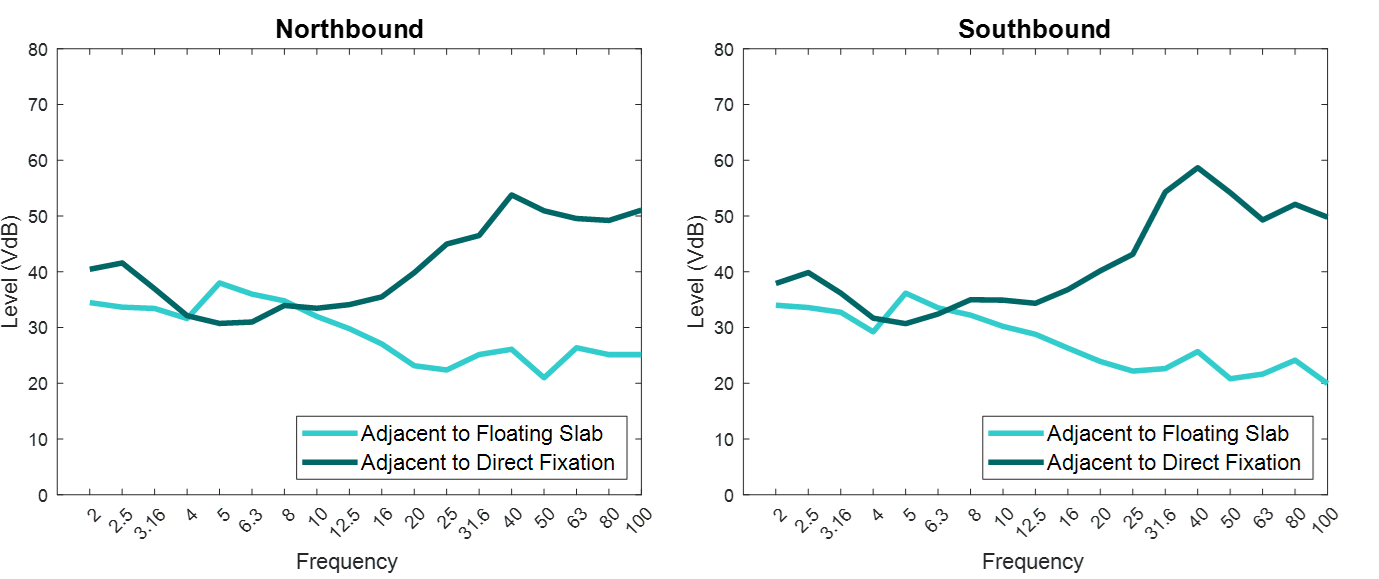
For the sake of comparison, Figure 9 shows VdB response at different frequencies for the floating slab track (light blue) and for direct-fixation track located outside the high-sensitivity zone (dark blue). The slab track shows a characteristic peak at 5 Hz (the design resonance) with increasing attenuation as the frequency increases. The DF track does not resonate at 5 Hz, but as the data shows, vibration levels are higher, and increase with frequency, Krainc said.
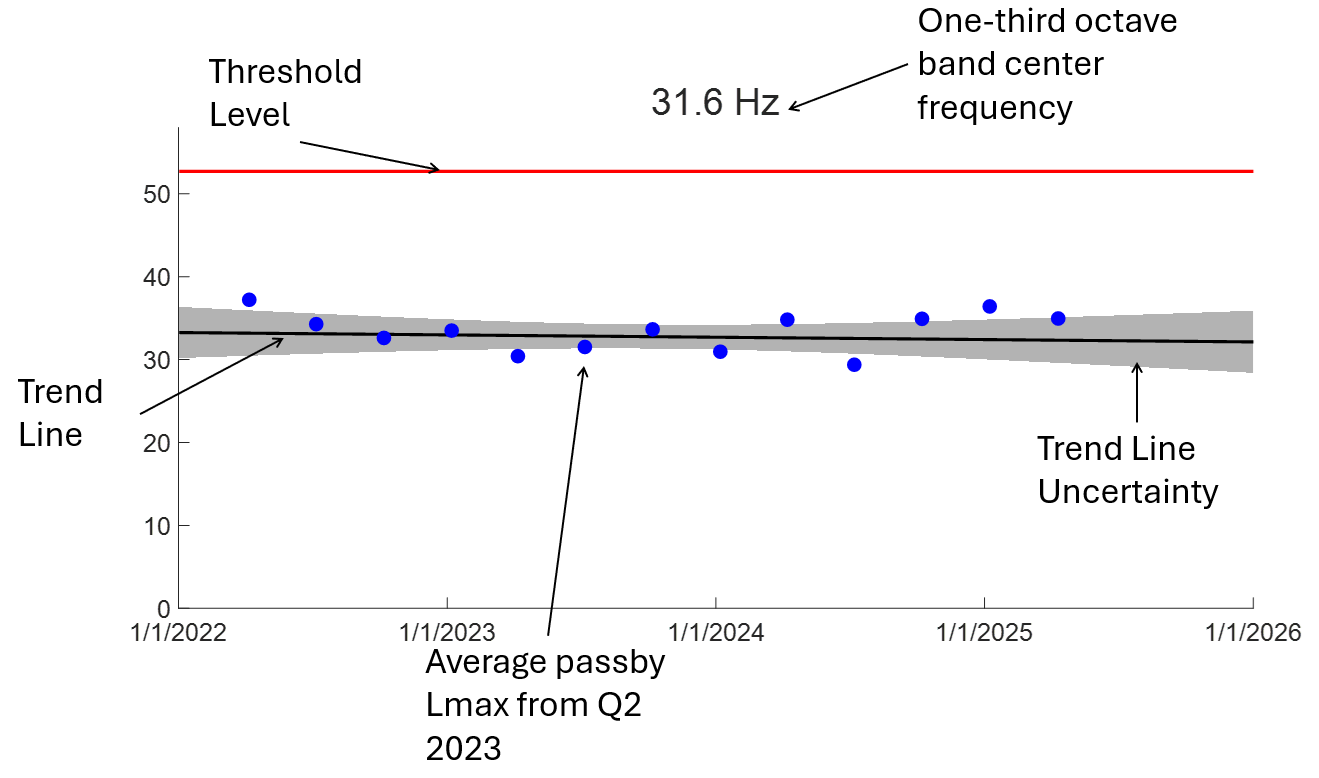
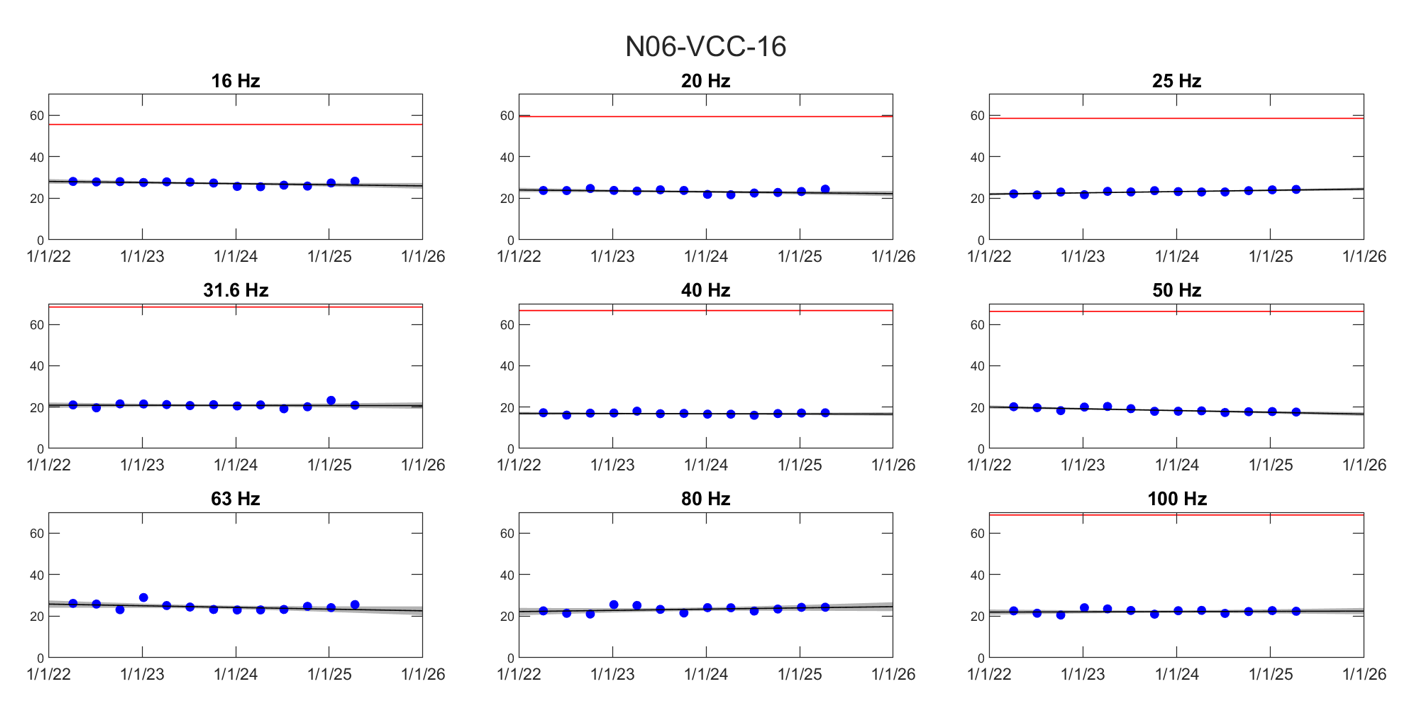
In addition to continuous monitoring, Wilson Ihrig also provides trend analysis of vibration data on a quarterly basis. This trending helps Sound Transit stay on top of wear, component degradation, and general maintenance requirements. An increasing trend, for example, may indicate accelerated wear, the development of a rail defect, the degradation of track components—there are many potential causes. Figure 10 shows one such trend report spanning years 2022 – 2026. The data shown is the average maximum VdB from a single sensor at a single 1/3-octave band (center frequency 31.6). The red line marks the threshold level (for this sensor, at this octave band). The trend line is flat, and there is a significant buffer between the data and the threshold, meaning this a fairly ideal result, Krainc said. “All the trends are flat. This is good news for the University, good news for Sound Transit, and good news for our monitoring and reporting. It means everyone is hitting their marks on the Master Implementation Agreement.”
Figure 11 shows trend data (2022 – 2024) for one sensor at multiple measured 1/3-octave bands; they are all, generally, flat. Some of the trends are even negative, implying that as the system has worn in, its vibration attenuation at certain frequencies has increased, Krainc said. As previously noted, maintenance practices also contribute to achieving these ideal trends.
Sound Transit goes to great lengths to ensure that rail grinding on sensitive track leaves behind a very fine, acoustically-ground surface finish that does not induce or excite resonance at revenue speed. As a result, the most recent grinding operation (as of publication) didn’t noticeably alter vibration trends, she said. Sound Transit’s wheel monitoring and wheel truing programs are also built around maintaining optimal wheel/rail interaction—the University site is also equipped with wheel flat detectors which trigger automatic slow orders if the threshold is crossed.
As the Northgate Link Extension continues to quietly hum along, this project is firmly in the monitoring phase, but there is still future work planned for leveraging the data collected by Wilson Ihrig’s sensor sites. This could include looking beyond trending to identify broader patterns; for example, as the site undergoes additional grinding cycles, will vibration levels remain flat? How do component, and vehicle/suspension/truck age affect VdB over time—this is, after all, a very young system. As Wilson Ihrig and Sound Transit continue to monitor this novel site, there are sure to be valuable results.

Jeff Tuzik is Managing Editor of Interface Journal
This article is based on a presentation made at the 2025 Wheel/Rail Interaction Transit Conference.
Images are courtesy of Wilson Ihrig / RWDI and Sound Transit except where otherwise noted.