Tools and Techniques for Optimizing the Wheel/Rail Interface
By Gary P. Wolf • July, 2007
Much has been written and said about the need to optimize the interface between the wheel and rail, but with the growth of heavy axle load traffic, the mandate for optimum performance is greater than ever. Balancing the wheel/rail equation and optimizing interaction can only be done through engineering analysis and the application of technology.
Task 1. Measuring and Defining Rail Parameters
Those charged with managing or maintaining a railway understand that rail (and its shape or profile) is the one asset that is entirely under their control. Wheels are another story. Unless a railway is a closed-loop operation, the interchanged wheels that pass through the system every day represent a wide range of conditions, shapes and profiles. With such uncontrollable variability in wheel conditions, it is imperative to control the rail profile in order to maximize its asset life, and minimize the risk of derailment. Of course, you know the adage: “If you can’t measure it, you can’t manage it.” Fortunately, there are tools that can accurately measure the profile and wear characteristics of rails and wheels.
Initially, only crude mechanical tracing devices were available to measure rail profiles. These devices were cumbersome, lacked accuracy, and did not capture any digital data on the profile shape. Today, however, there are a number of optical and laser-based devices that can measure the surface profile of the rail to an accuracy of thousandths of an inch at speeds up to 60 mph. These instruments can store the data digitally for analysis and reference to other measurements.
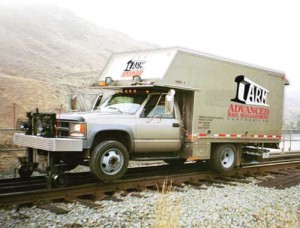
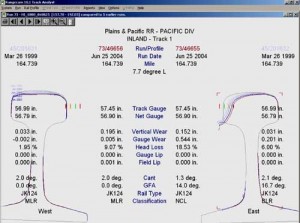
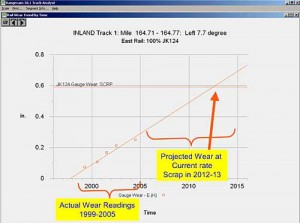
Optical Rail Measurement vehicles, such as those used by Advanced Rail Management Corp. (ARM), utilize a high-speed laser-measuring system to take a “snapshot” of the head and base of the rail every 5 to 15 feet on freight lines, and down to every foot or less, as required, in curves on transit and high-speed lines. Wear measurements on the ARM vehicles (see Figure 1), which utilize ORIAN laser measurement systems designed by KLD Labs, are accurate to approximately 0.001 inches across the running surface of the rail. From this profile snapshot, the software can determine the type and weight of rail, and the amount of side and top wear from its as-new condition. The system can also determine the gauge-face angle and cant of the rail, and calculate the percent of gauge wear, head loss and other programmable parameters. (Figure 2 shows the typical view of a left and right rail in a curve, and associated wear statistics. Figure 3 shows the predictive wear line for a given curve.)
Optical Rail Measurement can also be combined with track geometry measurement systems to accurately measure gauge, crosslevel and alignment, and precisely identify the locations at which exceptions are identified.
Task 2. Measuring the Wheels
For more than a century now, mechanical personnel have carried various AAR-approved wheel gauges in their coveralls. While the gauges are accurate, there is potential for error, as measurements are often taken under difficult conditions — under vehicles, in low light, with the users in awkward positions. While these “go/no-go” gauges serve a useful purpose, these types of static wear measurements do not address the overall wheel shape and the contact pattern the wheel makes with the rail.
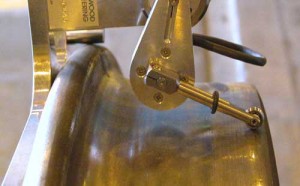
MiniProf®, the first generation of digitized wheel profile measurement systems developed by Greenwood Engineering, changed all that. MiniProf captures a digital image of the wheel profile as a mechanical stylus is advanced across the tread surface and flange of the wheel (see Figure 4). Advances in laser technology have provided new options in digital wheel measurement.
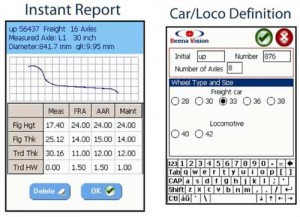
Beena Vision and Rail Sciences Inc. developed LazerView, a hand-held laser profiling system that is attached by a magnetic fixture to the rim of the wheel (see Figure 5). The measurements, which have a resolution of 100 micrometers, are downloaded to a PDA device and are available for immediate comparison against selected AAR, Federal, or railroad maintenance standards.
Figure 6 shows a screen shot of the captured profile and the key measurement standards. In addition to the accuracy of the digital measurement systems, an inspector using the LazerView measurement system, for example, can make the four key wheel measurements in half the time as an inspector using conventional wheel gauges.
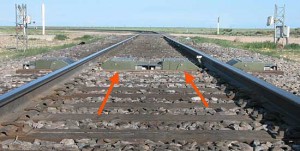
In addition to hand-held digital measurement systems, automated in-track laser measurement systems have been introduced by railway systems around the world. These systems, which are installed in the ballast between ties or within hollow steel ties, are able to measure both wheels on a wheelset at track speed (see Figure 7).
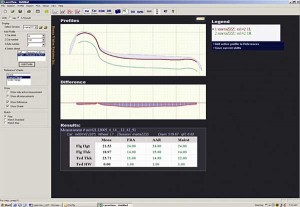
Beena Vision’s WheelView system, which is marketed by Rail Sciences Inc., can measure and record parameters such as flange height, flange thickness, rim thickness and tread hollow at up to 65 mph with resolution of 0.05 mm, and repeatability of between 90% and 100% for multiple readings of the same wheel. Figure 8 shows an overlay from the database of a wheel profile to a new wheel.
The Massachusetts Bay Transportation Authority installed WheelScan, KLD Labs, Inc.’s automated laser measuring system, on the MBTA Green Line to monitor wheel profile conditions and to “flag” wheels that are at or approaching pre-set wear limits.
These and other types of automated in-track wheel measurement systems are being installed and tested on railways in North America, the U.K. and the Middle East, among others.
Task 3. What to do with all the Data
While the ability to record digital wheel and rail measurements is good in and of itself, the information can also be used to analyze the performance of typical wheels on a railway’s established rail profile. Closed-loop systems, such as transit systems or mine-to-port operations, have the ability to control both wheel and the rail profiles. Typical freight operations, which handle free-interchange cars, must work with an average worn profile of cars operating on the system.
In either case, the goal of wheel/rail profile optimization is to maintain wheel and rail profiles to a shape that will maximize the life of both assets by reducing the contact stresses and wear that develops at the wheel/rail interface. In the process of minimizing wear, the risk of derailment, related to contact fatigue cracking at the gauge corner or top of rail, and shelling on the surface of the wheel tread, is also reduced. Both of these “surface” failure modes can lead to subsurface cracking of either the wheel or rail and, ultimately, to catastrophic failure.
While lubrication can reduce rail gauge-face wear, some level of wear is beneficial in removing incipient surface cracks. This “magic wear rate” can be achieved through optimal wheel/rail interaction, or more typically through controlled artificial wear generated by periodic rail grinding.
A significant by-product of minimizing wheel/rail contact stresses it that wheelset steering in curves is greatly improved. When the wheel is centered on the rail correctly, the maximum steering moment is achieved. This reduces the risk of derailment due to wheel climb or rail rollover. Harmonic activity between the wheel and rail, which can lead to rail corrugations or wheelset hunting at higher speeds, is also reduced when wheel/rail profiles are in sync.
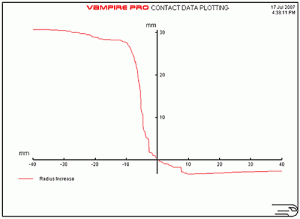
An optimized wheel/rail profile system will allow wheelsets to shift laterally in curves and develop rolling radius difference as the wheel moves across the rail head. Approximately 3 – 4 mm of rolling radius difference should be developed when the wheel flange is in contact with the rail in curves. Track gauge and the wheelset back-to-back dimensions also factor into rolling radii analysis (see Figure 9).
Software programs, which can process thousands of wheel profiles, can be used to perform statistical analysis of existing profile conditions, and to determine the average worn wheel profile. They can also be used to analyze specific profile conditions when investigating a derailment or excessive wheel or rail wear condition. More advanced analysis makes use of vehicle dynamic simulation programs such as VAMPIRE®, which was developed by British Rail in the 1970s and has become a standard tool for performing vehicle dynamics analysis and wheel/rail optimization studies.
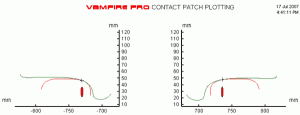
Programs have been developed to integrate digital data from rail and wheel measurement systems to create the “wheel/rail geometry” file (see Figure 10) that VAMPIRE® uses to calculate the wheelset steering and creep forces (which are generally based on Hertzian contact theory and Kalker coefficients). With this information, the model calculates the amount of energy consumed at the flange and tread surface for a given wheel/rail profile combination, as well as the lateral and longitudinal wheelset creep forces, which indicate the wheelset’s steering efficiency.
Using information from simulation models, parametric studies can be performed that sequentially analyze how small changes in the wheel or rail profile shape effect energy consumption, wear and steering at the contact patch. The optimum combination can be developed for any given operating environment, whether transit, high-speed passenger, or heavy-haul freight.
Clearly, there is much to be gained from wheel/rail optimization. There are, however, a few caveats that must be considered before launching an optimization program:
— Be cognizant of cost vs. benefit issues. Optimization of wheels and rails requires additional maintenance, such as keeping track geometry up to standard, the potential need to true wheels more frequently, and periodic rail profile grinding. Some closed-loop rail systems such as Mount Newman Mining in Australia and Quebec Cartier Mining in Canada have achieved remarkable benefits in extended rail and wheel life. But, they’ve done it through dedicated track maintenance, rail grinding and wheel truing efforts. Once you start down the path of optimization, you must stay on top of maintenance. Once you let the system degrade, it may be very costly to get back to where you once were.
— There are no simple solutions; one size does not fit all. Each rail system may have unique conditions such as long tangent sections, heavy curve sections, tight curve radius, or high-speed operation — each requiring different solutions.
— Check constantly to be sure you are not generating any adverse effects with your optimization program. Solving one problem often creates another. This is often true in the rail industry. Keep an eye out for possible downsides to the changes you are putting in place.
— There are many variables to the wheel-rail interface equation. Changing one variable could have adverse effects on others. Issues such as rail lubrication, overall truck maintenance, and track geometry maintenance can have profound effects on the wheel/rail contact geometry. All these factors should work in harmony for optimal results.
— Last, but not least: Achieving the optimum solution in a rail organization requires all departments pulling on the rope in the same direction. One department working alone will not achieve the intended results. Political solutions often must be brought into play to reap the engineering benefits.


