
A Primer on Vehicle and Track Measurement Systems
by Jeff Tuzik
Measurement is the foundation of design, optimization, and maintenance. No system functions without accurate measurement, and the railroad is no exception. But measurement systems used in the industry have a come a long way since the days of the string line and protractor; the contemporary array of systems, equipment, and methods is expansive, but it doesn’t have to be unapproachable.

The best way to conceive of measurement systems is to break them down into categories based on where they are installed and what they measure. “When you boil it down, there are six categories [of measurement systems],” Matt Dick, Head of Rail Strategy & Development at Engineering Systems, Inc., said at the Principles course of the 2026 Wheel/Rail Interaction Conference. These categories are:
- Mounted on the vehicle to measure the vehicle. These devices typically monitor specific components or characteristics such as bearing temperature or vibration.
- Mounted on track to measure the track. This includes devices that monitor things like rail stress (strain gauges), or rail neutral temperature, and the like.
- Mounted on the vehicle to measure the track. These can be manned or unmanned vehicles that traverse the track to measure things like rail profile, track geometry, rail defects, and internal rail flaws.
- Mounted on the track to measure the vehicle. These are wayside and track-mounted systems like wheel impact load detectors (WILDs), wheel profile measurement systems, and camera/machine vision systems.
- Mounted on the vehicle to measure vehicle and track. Instrumented wheelsets which measure dynamic wheel loads, and Vehicle/Track Interaction monitors which measure the vehicle response as it runs over the track.
- Mounted on the track to measure vehicle and track. An example of this is an L/V monitor, which measures the vertical and lateral forces imparted to the track by a passing vehicle/wheelset.
Clearly, many of these categories are mirror images of each other. This means that there is a lot of common technology, Dick said. For example, a laser-based rail profile measurement system can be flipped over and repurposed to measure wheel profiles. It’s not nearly that simple, but the principal technologies are the same. Vehicle/Track Interaction (VTI) monitors measure impacts at the axle to detect things like battered joints and track surface conditions in much the same way WILDs measure the rail to detect wheel impacts to detect wheel flats or out-of-round wheels. “Machine vision is used across the board. Whether you’re inspecting the track or the train, you’re applying the same technology.” Instrumented wheelsets and (wayside/track-mounted) truck performance detectors use very similar technologies to measure lateral and vertical forces. (See also The How and Why of L/V-based Thresholds and New Approaches to Dynamic Wheel Force Measurement – Part 1 for more information.)
Drilling down further into these categories reveals not only how they’re measured, but why they’re measured, and the type of data some of these measurement systems produce.
Geometry Measurement
Aside from the mandatory testing for track geometry exceptions, railroads collect geometry data as part of the overall monitoring of their track conditions. The data is used extensively for both maintenance and optimization. So, geometry measurement systems are a fairly standard and ubiquitous part of the measurement kit. They’re mounted to a variety of platforms including manned and unmanned, self-propelled and towed inspection vehicles, and on hi-rail vehicles: an example of category 3 (mounted on vehicle to measure track).
These systems typically work by measuring rail position in relation to a reference point that is generated by an inertial package, whose position in 3-dimensional space is continuously monitored to measure track geometry [the space curve of the geometry], said Rafael Maldonado, Deputy Division Manager at ENSCO Rail. (For more information on space curve versus mid-chord offset measurements, see the AREMA Manual for Railroad Engineering, chapter 2, part 3.) Such systems measure things like profile (also called vertical alignment), alignment (also called horizontal alignment), crosslevel, curvature, gage, warp, twist—the full range of standard geometry parameters (see Search Results for “track geometry” for more information). In measuring track geometry, it’s important to consider the difference between loaded and unloaded track geometry.
A light hi-rail vehicle weighs a small fraction of the weight of a locomotive or loaded car, so the geometry it measures is effectively unloaded. Under load, conditions can look quite different. A 2017 study performed by Norfolk Southern, the FRA, and ENSCO directly compared geometry measurements taken by a hi-rail vehicle (unloaded) and a railbound track geometry car (loaded), said Matt Dick. The major takeaways from that study were:
- Gage is typically wider in curves under a loaded, rather than an unloaded, light high-rail vehicle. This is largely due to much higher creep forces due to the higher vertical load, resulting in higher gage-spreading forces.
- Strong track showed relatively little difference between loaded and unloaded measurements.
- Weak track showed difference between loaded and unloaded measurements.
“If you have weak spots in the track, a loaded track geometry car will exercise them, but a light hi-rail vehicle may not,” Dick said.
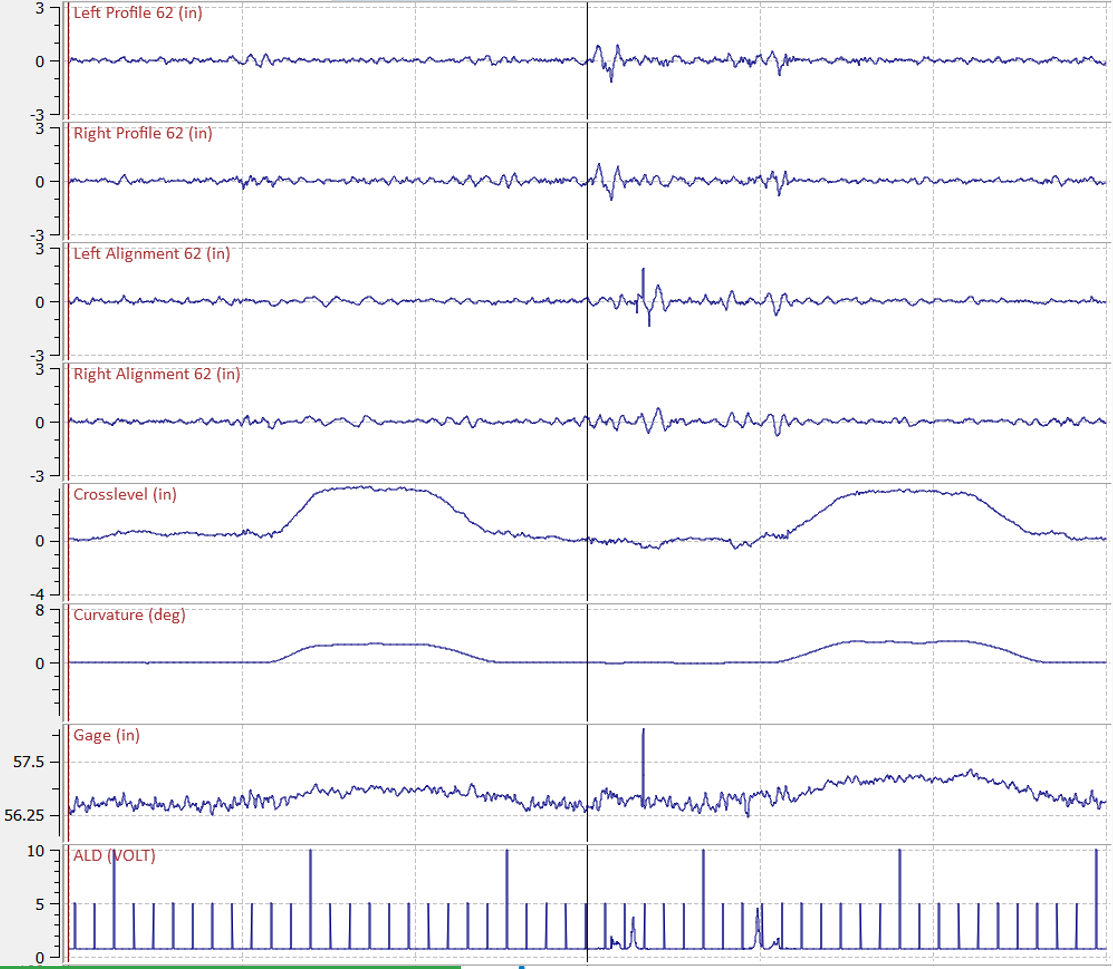
Figure 1 shows an example strip chart generated by a track geometry system. When the data is presented as such, synchronized and aligned, it’s easier to detect patterns where, for example, multiple geometry conditions are present at a single location—indicative, perhaps, of an underlying issue, Maldonado said.
Profile Measurement
Rail profile measurement is another example category 3. Like track geometry measurement, rail profile measurement is a universal practice in the industry. Often times, profile and geometry data are collected in tandem—a practice that makes it easier to synchronize and align the data based on location since both devices can effectively share encoder location data.
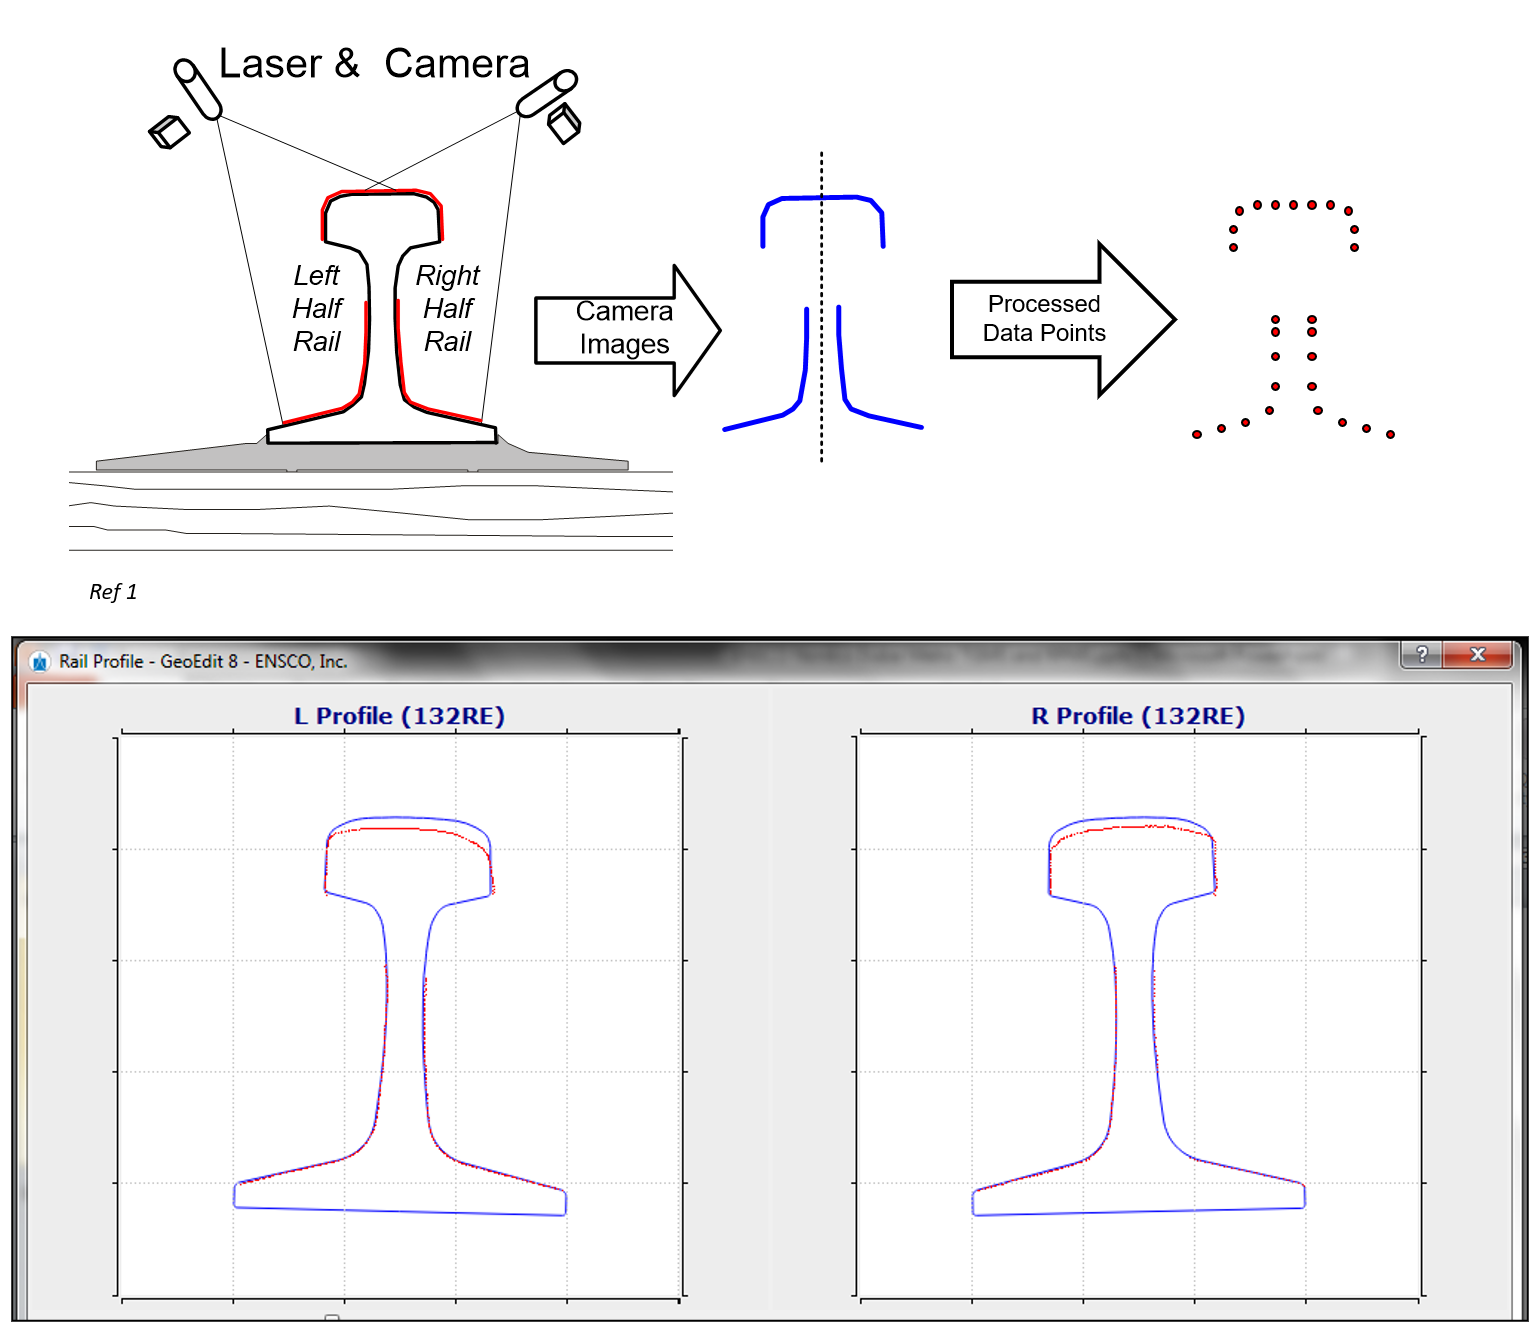
Figure 2 (top) shows how rail profile data is measured. A pair of lasers and cameras are positioned on either side (field and gage) of each rail in order to capture a transverse “slice” of the entire rail. “There are single-sided systems that measure half-profiles if you’re more interested in rail cant, but these are more specialized cases,” Maldonado said. Figure 2 (bottom) shows an example of left and right rail profile measurements. The red profile is the measured profile, which is overlayed with a new rail template of the same rail type in blue. There are different methodologies for automatically identifying rail type by best fit, but it often requires fine tuning, he said. Correctly identifying the rail type is necessary to perform various relative measurements including vertical wear, head loss, gage/field wear and total height. Heavily worn rail can look vastly different to new rail, and an incorrectly identified rail type will throw off various measurements. However, not all measurements require the rail type to be identified. These include cant, gage-face angle, gage and/or field lip (metal flow), and head width.
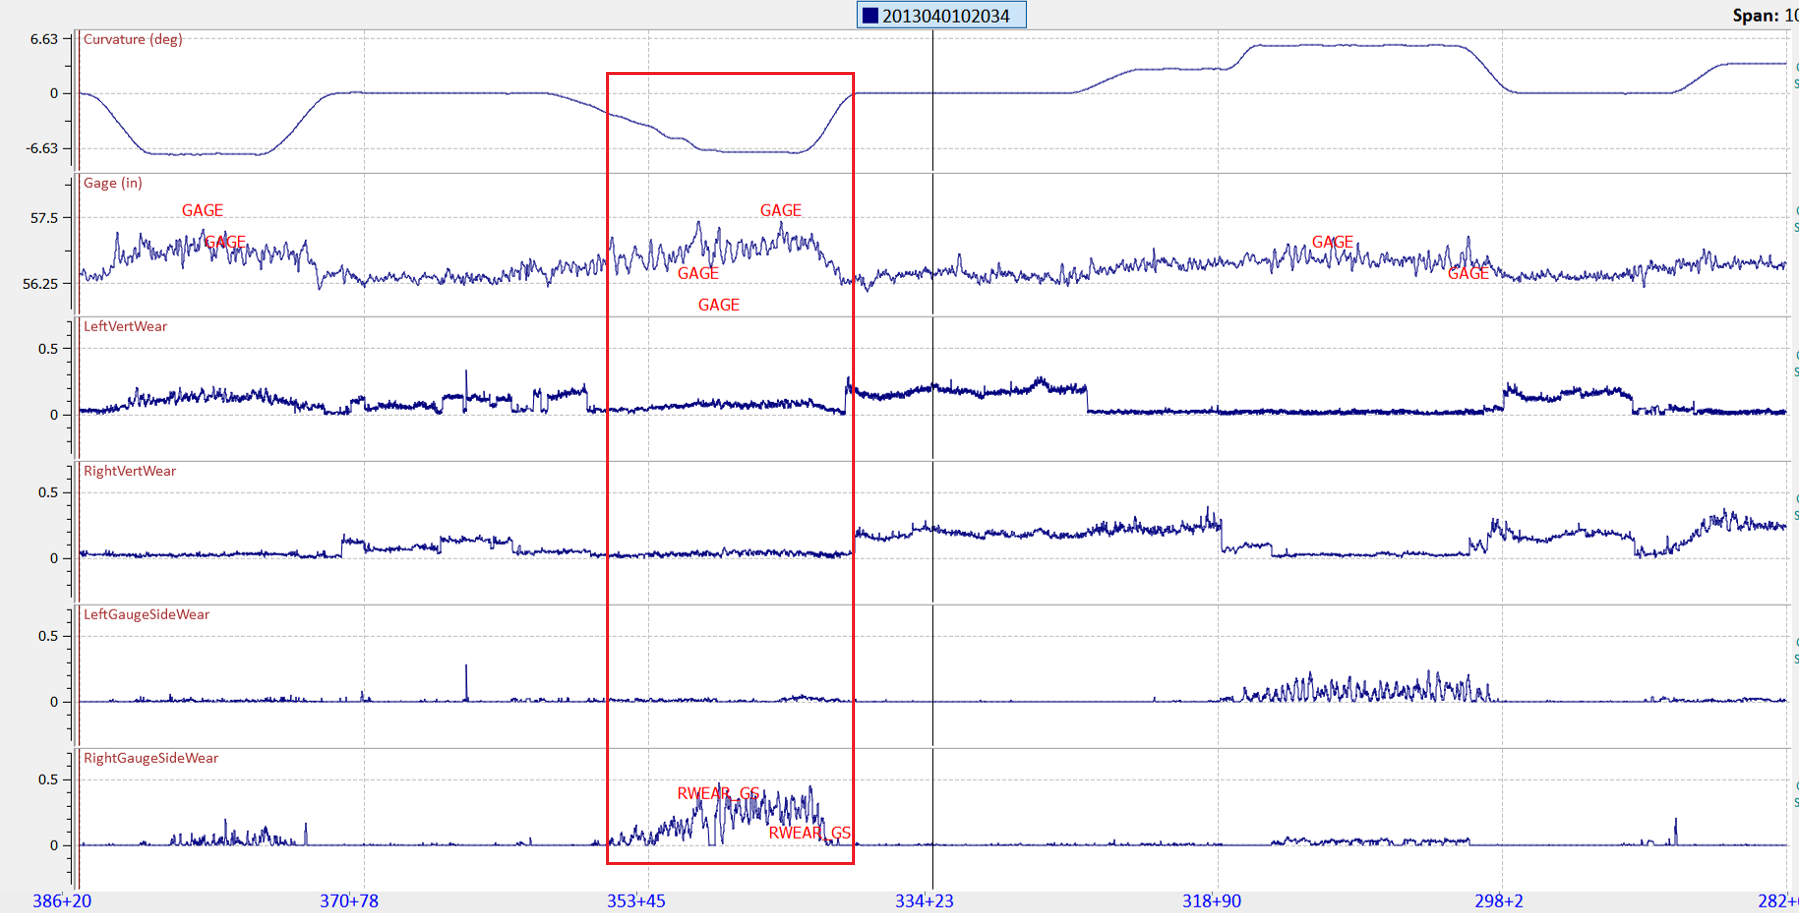
Figure 3 shows a typical strip chart displaying data collected by a profile measurement system. Like with the track geometry chart in Figure 1, the alignment of the data here reveals patterns and insights. The red box, for example, shows widened gage and increased gage wear on the right-hand rail through the left-hand curve, but very little gage wear on the left-hand rail.
Wheel profile measurement systems, which are conceptually similar to rail profile systems, are an example of category 4 (mounted on track to measure vehicle) systems. As in rail profile measurement, these systems use pairs of lasers/cameras to capture a transvers slice of each wheel as it passes through the installation. From this data, flange height, flange thickness, rim thickness, and wheel back-to-back distance can be measured.
Impact Measurement
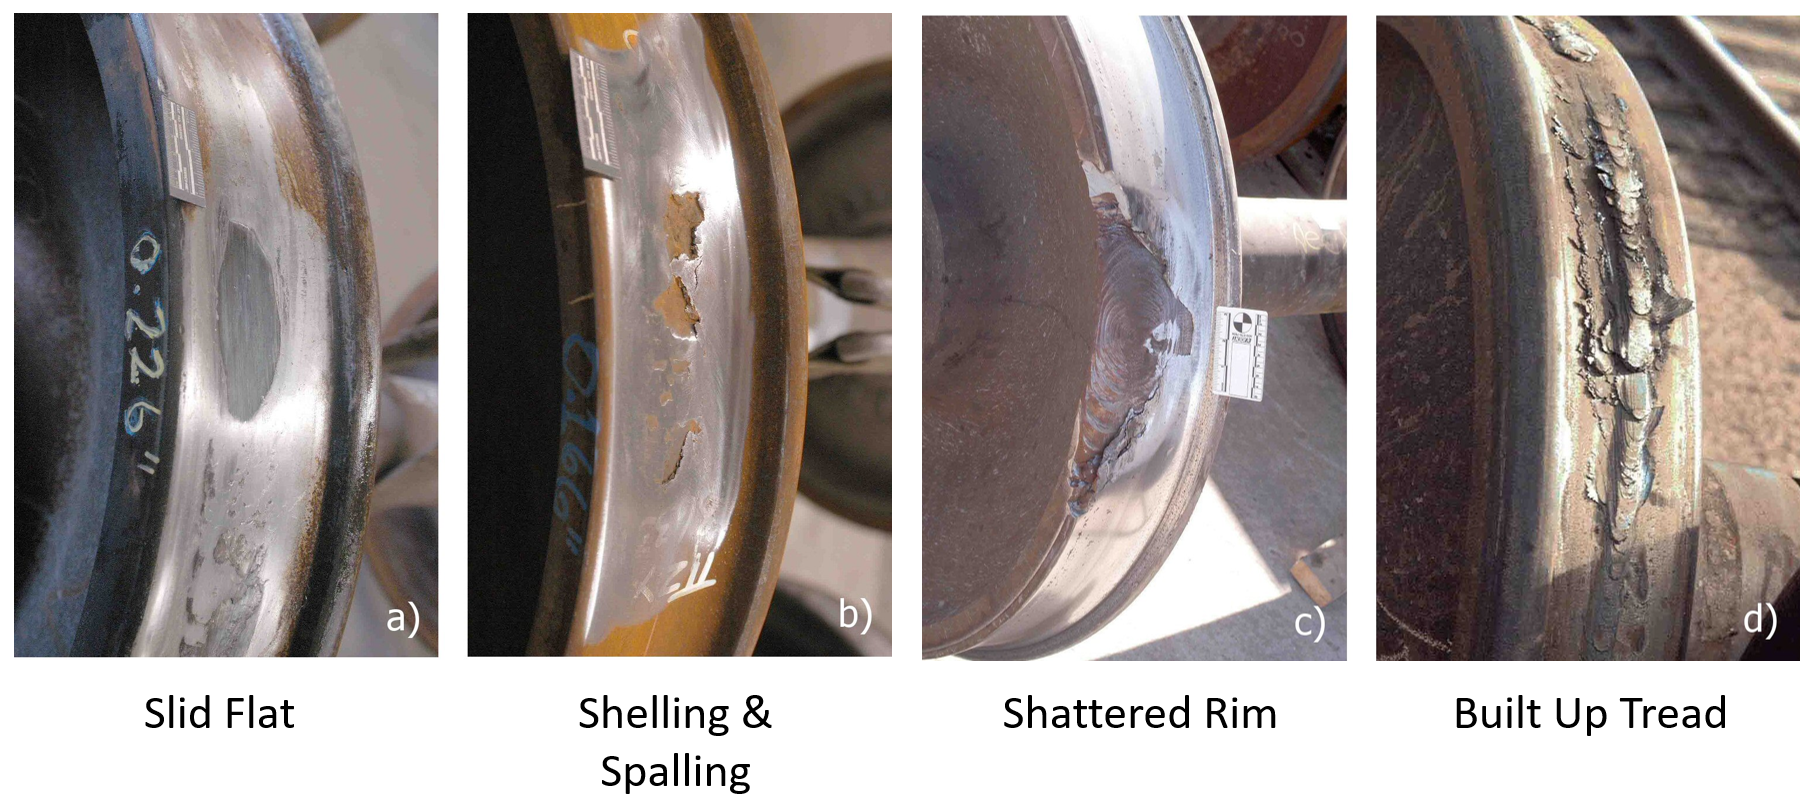
Wheel impact load detectors, or WILDs, (category 4: mounted on track to measure vehicle) are wayside/track-mounted that use strain gauges to monitor rail stress over a length equal to or greater than a wheel circumference in order to detect high-impact wheels that can and will damage the track. WILD data is used to measure nominal load (in kips), peak load, dynamic load (peak minus nominal load), and the ratio of peak/nominal load, Maldonado said. Data from WILDs is the foundation for the AAR 90-kip limit, which enables railroads to pull and bill the car owner for any wheel that exceeds this threshold. High-impact wheels that hit or exceed the 90-kip threshold typically suffer from defects such as slid flats, shelling and spalling, shattered rim, and built-up tread. Figure 4 shows examples of each of these defects.
But there are other factors that can influence wheel impacts, Maldonado said. The same car will generate different impact loads when it’s loaded versus empty. A shifted load in a car can also be detected by WILDs— and train speed plays a role, as does track stiffness. “Proximity to crossings or bridges, mud spots, and fouled ballast will all affect your measurement accuracy.”
With any wayside/track-mounted installation, location is critical. It’s important to match the location to the measurement system, said Matt Dick. WILD sites should aim for relatively high train speeds, such as on main lines. Line scan machine vision systems should be located where there are consistent train speeds, without rapid acceleration or deceleration. Truck condition monitors (T-BOGIs) should be located on tangent track. Proximity to lubricators is important to be aware of, too—L/V detectors, for example, can’t take proper measurements at a location saturated by lubricant, unless they are intended to assess the lubrication performance. And all systems should be located at a distance appropriate to any potential remedial action that must be taken, Dick said. “If you can process and react to the data fairly quickly, it makes sense to position the site next to a rip track or depot. If it takes a while to process the data, it makes sense to place that installation further away.”
Vehicle/track interaction monitors (V/TIs) are the vehicle-based counterpart (category 5: mounted on a vehicle to measure vehicle and track) to the WILD and T-BOGI systems. “It’s best to install these systems on revenue service vehicles to maximize their uptime and coverage,” Maldonado said.
V/TIs typically measure accelerations (which can be converted to impact force) at the axle. The data can be used to find things like cracked frogs, battered joints and broken joint bars, rail breaks, and other track conditions that are likely to cause high impacts. V/TIs are also useful in that they can measure track geometry perturbations in shorter chord lengths than are typically used in geometry measurements. Instead of 31, 62, or 124-foot chords, V/TIs can look at 10-foot chords, for example, and may find localized geometry issues that are masked by longer chord measurements, Maldonado said.
Machine Vision
Machine vision systems tend to occupy categories 3 and 4. They are wayside installations monitoring vehicles, or vehicle-mounted systems monitoring the track. These systems pair cameras (images and video, both 2D and 3D scans) with a variety of specific algorithms that can sort through the tremendous amount of data such systems collect, and provide autonomous or semi-autonomous monitoring of their target. Machine vision systems can be used to measure individual components, such as friction wedge rise, or broken springs, and even rolling contact fatigue, Maldonado said. “The key to making any machine vision system useful is building the right algorithm—one that is accurate and reliable. No human has the time to go through all this data.”
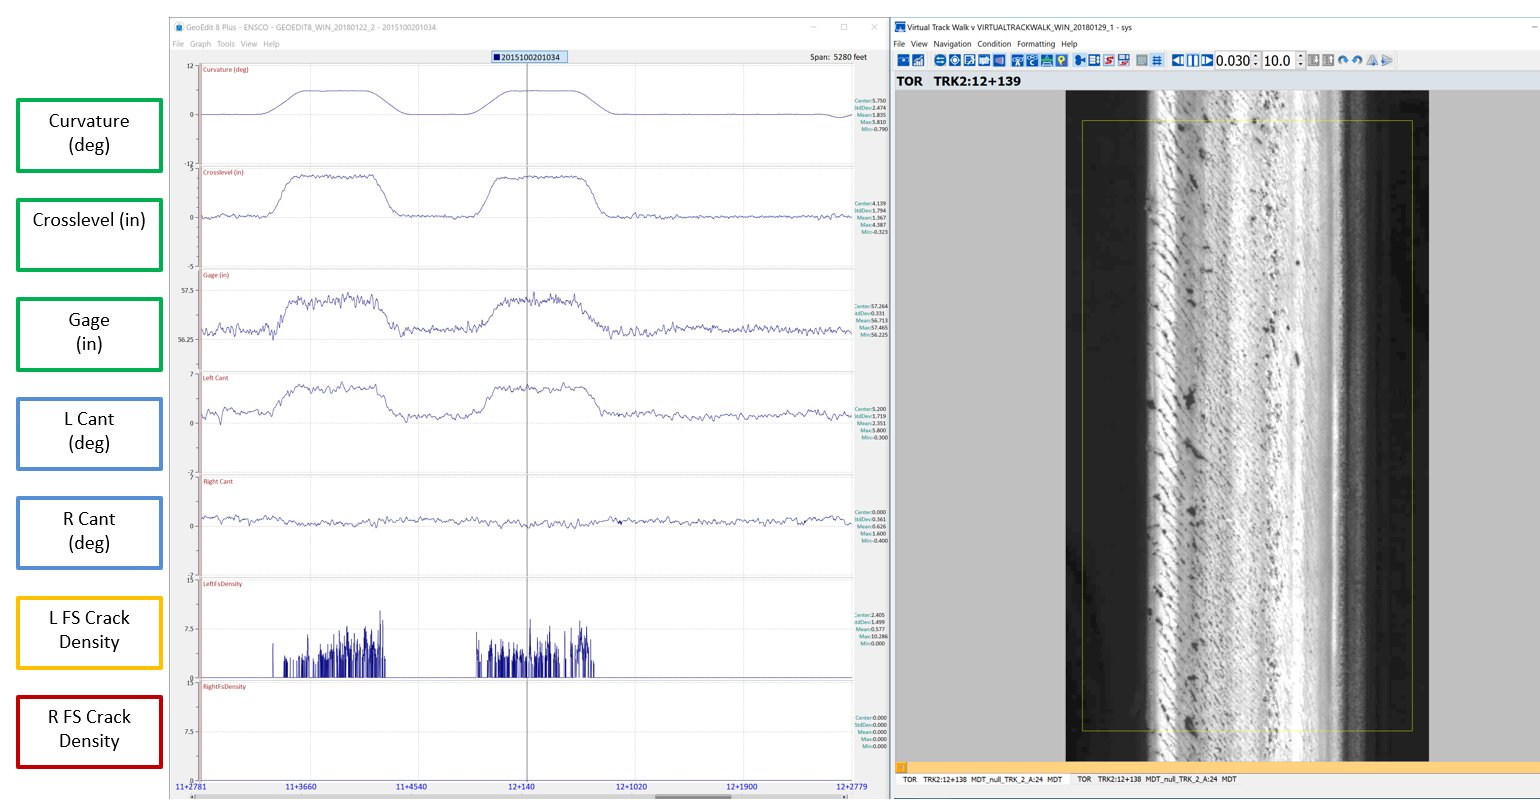
“One big thing we’re starting to see is quantified data from images,” Maldonado said. Figure 5 shows data from a machine vision-based RCF measurement system in which an algorithm has been developed and trained to quantify crack density based on line scan images (note the crack density measurement and the corresponding image at the location selected in the strip chart). “It’s hard to trend, or to make a decision based on a mere image, but if it can be translated into a dataset, it becomes very useful.”
In-Train Forces
In-train forces (buff and draft) have always been important, but as trains have gotten longer, these forces may be amplified, as well. There are various on-board instruments in use to measure these forces, including instrumented couplers, carbody accelerometers (which are also used in many other applications), and brake-pipe and brake-cylinder-pressure gauges. These are all autonomous measurement devices, able to transmit data wirelessly, aimed at monitoring for the kind of train handling and in-train force conditions known to have the potential to cause a derailment.
The many technologies in the vehicle and track measurement space are too numerous to list, and the number grows constantly. There are always new measurement systems, and there are always new ways to leverage existing measurement systems. The systems mentioned in this article are only some of the most common, and most widely used in the industry. For more specific and in-depth coverage of various measurement systems, see articles tagged with Measurement Systems.

Jeff Tuzik is Managing Editor of Interface Journal
This article is based presentations made at the 2025 and 2026 Wheel/Rail Interaction Principles conferences.
Images are courtesy of ENSCO Inc. except where otherwise noted.