
The How and Why of L/V-based Thresholds
by Jeff Tuzik
The L/V ratio is a ubiquitous measurement in the world of wheel/rail interaction. It is typically combined with the Nadal limit, functioning as shorthand for wheel climb derailment risk for a given set of conditions. But the L/V ratio and the various formulae used to set risk thresholds are anything but simple. In addition to wheel L/Vs, which are used to assess wheel-climb and rail rollover potential, net truck L/Vs can be used to determine the risk of track panel shift or other deleterious effects that can occur even when contact conditions fall below the Nadal limit.
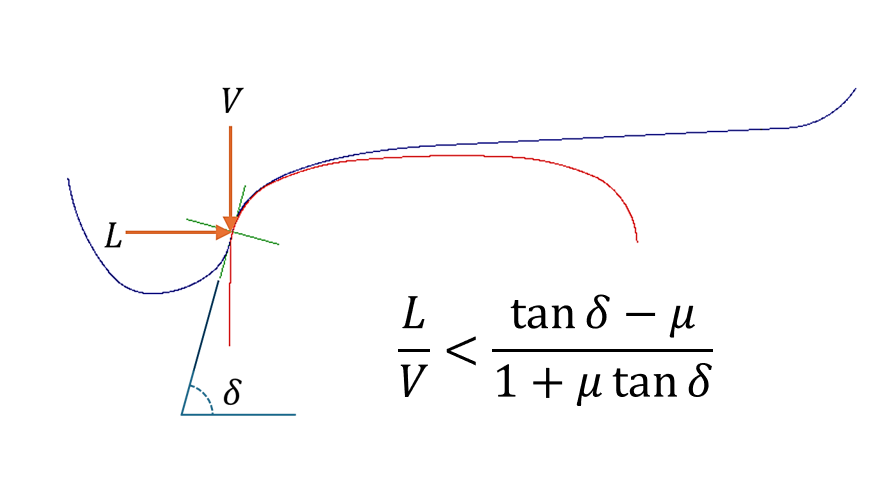
Typically, the derailment risk presented by a specific L/V value is contingent on the Nadal criterion, which takes into account wheel/rail contact conditions—specifically: flange contact angle δ and coefficient of friction μ (see Figure 1). The derailment threshold, or the Nadal limit, indicates contact conditions in which the balance of lateral versus vertical forces is such that wheel climb is likely to occur.
A Complicated Relationship Between Wheel and Rail

Per the AAR, an L/V threshold of 1.0 is used to assess the service worthiness of new freight cars. A more conservative L/V value of 0.82 is generally used as the threshold for high-rail wheel climb in a curve. To put this into perspective, an L/V value of 0.82 requires a flange contact angle of ≤68-degrees and coefficient of friction of ≥0.5. The L/V = 0.82 threshold appears in the 1992 AAR Train Make-Up Manual. The manual also indicates that at L/V = 0.75, a worn wheel flange/worn rail-contact condition may induce wheel climb. “These are both very conservative thresholds, and they were determined based on the AAR 1:20 wheel profile, which is no longer in use,” Yi Wang, Principal Investigator in the Vehicle-Track Interaction Group at MxV Rail, told delegates at the 2025 Wheel/Rail Interaction Heavy Haul conference. “It’s worthwhile to assess whether these thresholds are still relevant today.”
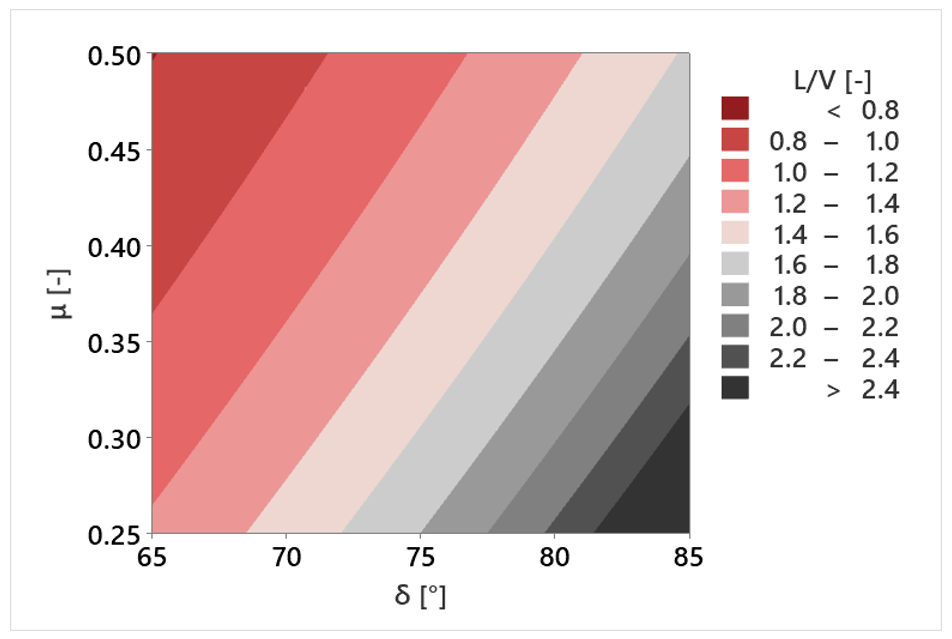
One of the critical aspects of the L/V value is that it is variable for a given wheel (the flange contact angle and coefficient of friction [COF] are constantly in flux as it rolls down the track) and for a given location on the track—each wheel presents its own unique flange angle and COF (see Figure 2). “This is what makes the Nadal limit hard to pin down,” Wang said. ”You have two constantly changing variables.”
Calculation of practical and accurate L/V thresholds is complicated by the fact that the Nadal formula isn’t necessarily the best fit for all wheel/rail contact conditions. For example, while Nadal is considered correct for conditions of high angle of attack and low longitudinal creep (i.e. low traction/braking/friction), it is considered overly-conservative in low angle of attack, high longitudinal creep conditions, Wang said. This is where modifications and addenda to the Nadal formula such as the Weinstock derailment criterion come into play.
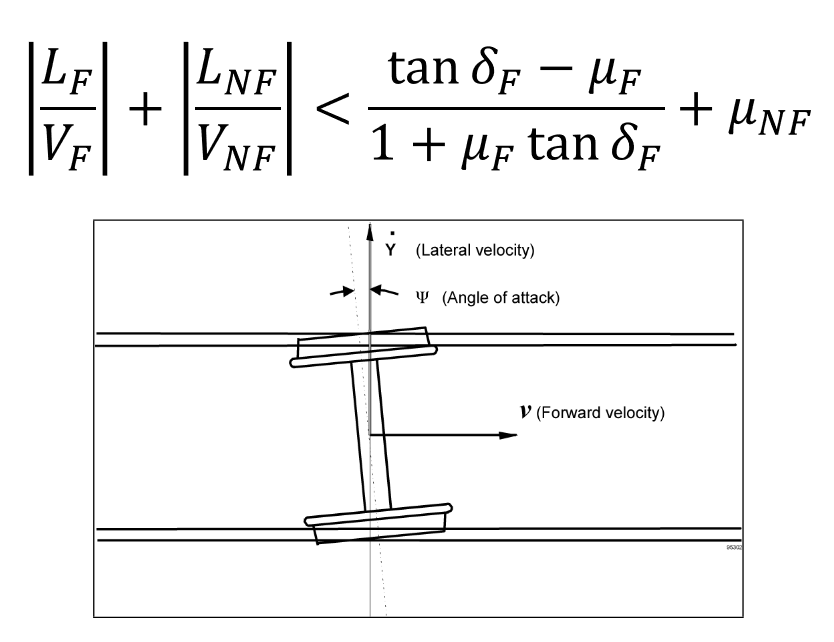
Weinstock (see Figure 3) takes into account the L/V of the flanging and the L/V of the non-flanging wheels and states that if the sum of these figures is below the Nadal limit, plus the coefficient of friction of the non-flanging wheel (![]() ) then the wheel climb threshold is not met, Wang said. The Weinstock criteria can provide a more accurate prediction of real-world derailment risk, in certain scenarios such has high positive angle of attack, Wang said.
) then the wheel climb threshold is not met, Wang said. The Weinstock criteria can provide a more accurate prediction of real-world derailment risk, in certain scenarios such has high positive angle of attack, Wang said.
Weinstock highlights the fact that many factors influence L/V and that L/V ratios alone don’t necessarily paint a complete picture of derailment risk, Wang said. “In a real-world wheel-climb incident, angle of attack and contact conditions over time are critical factors.” Since the development and widespread application of the Weinstock criterion, other criteria have been developed to more accurately describe the nuance of L/V and wheel climb. Examples include time-duration-based, distance-based (see FRA Track Standards 49 CFR 213.333), and time-or-distance-based criteria (see Chapter 11, AAR M-1001). “These criteria are designed to address the fact that, in practice, we can exceed the Nadal limit L/V threshold without causing flange climb,” Wang said, “so it’s important we look at other factors in the wheel/rail interface.”
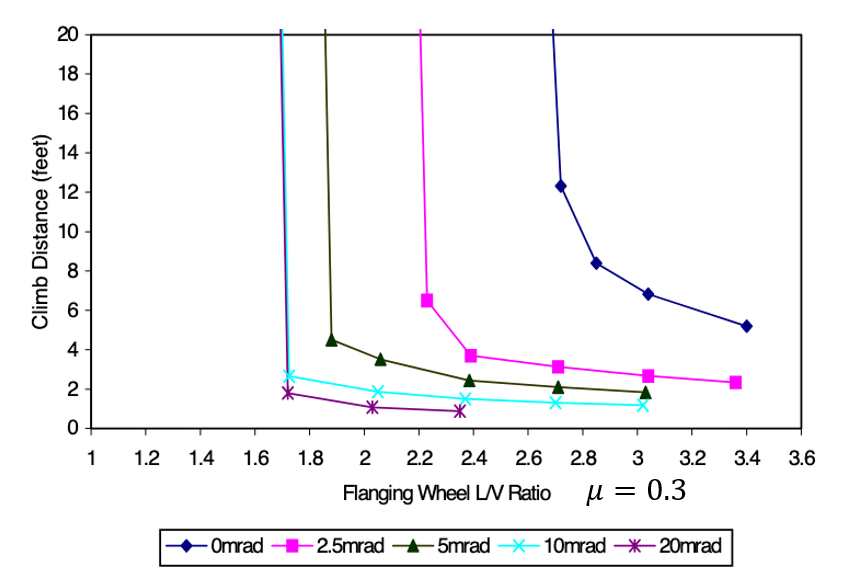
Figure 4 shows a distance-based assessment of wheel climb risk based on flanging wheel L/V ratios with an assumed COF of 0.3 (along the X axis) and the distance each wheel must travel (at a given L/V) in order to climb the rail on the Y axis. Each line represents conditions at a different angle of attack. “To the right, [the dark blue line in the graph] we’re looking at some very high L/V thresholds; much higher that we’d find with the Nadal limit,” Wang said. This means that, when accounting for angle of attack, the standard Nadal criterion isn’t necessarily the most accurate representation of wheel-climb risk.
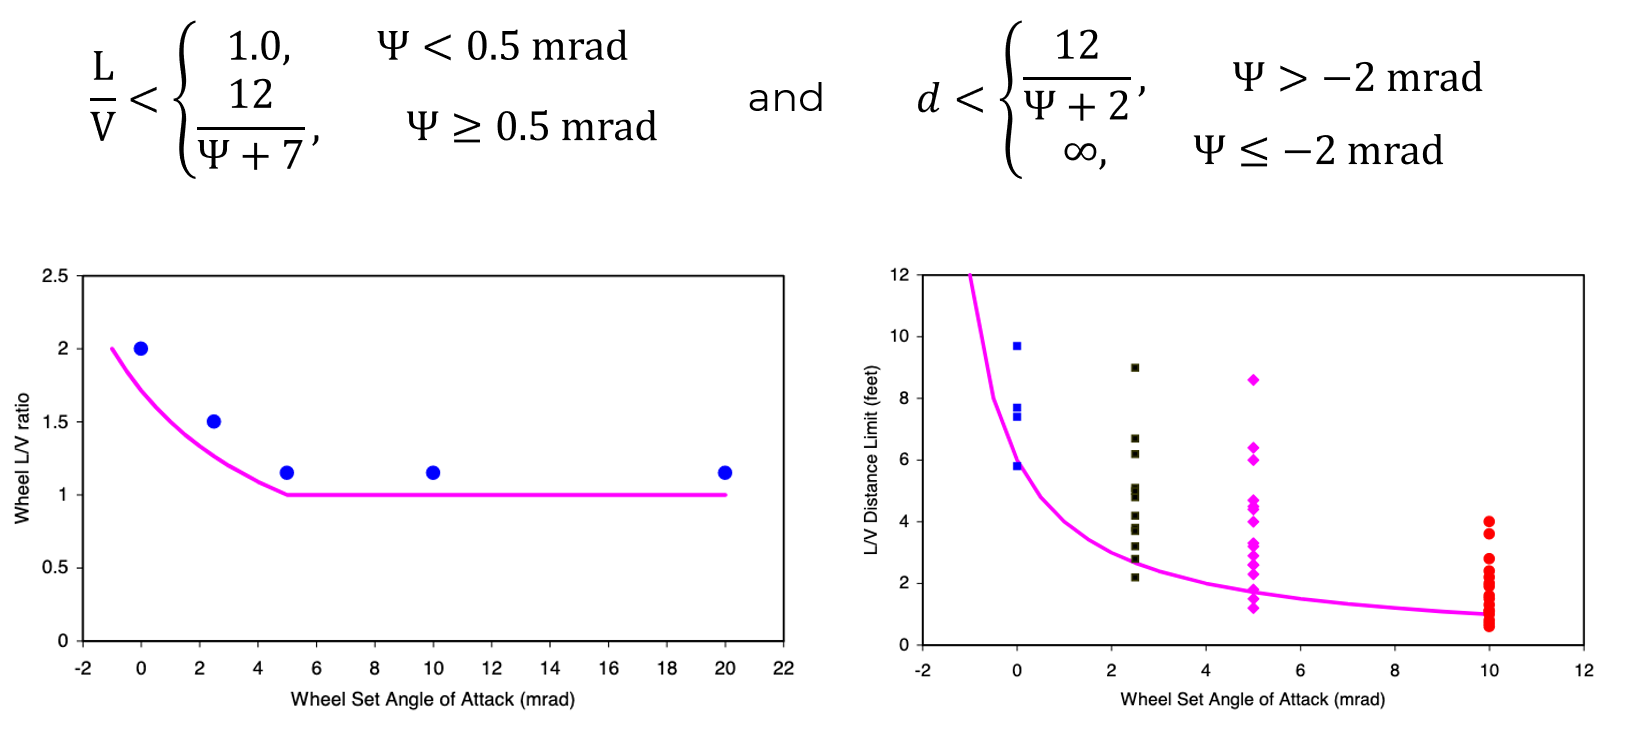
The figures in Figure 4 are based on the Elkins/Wu threshold (see Figure 5), which assesses both wheel L/V versus angle of attack (Ψ), and the distance a wheel travels at an L/V value (d) versus angle of attack (Ψ). “We can see from this threshold that if you have a negative angle of attack, you’ll never have a flange climb, regardless of your L/V,” Wang said. “But that doesn’t mean we can rely only on this threshold and ignore our L/V ratios.”

In addition to assessing wheel climb/derailment risk, L/V is also a basic metric in evaluating rail rollover potential. If the truckside L/V is lower than the rail base-over-height ratio, a rail rollover is possible (depending on track fastening resilience). It is also possible for net truck L/V to be high enough to shift the entire track panel laterally. This threshold is often defined by the Prud’homme or Li/Shust limits, and in FRA Track Standards 49 CF 213.333.
L/V From a Track Perspective
The limits, thresholds, and criteria detailed thus far are based on static track geometries and rail profiles. But the wheel, track, and vehicle are not a static system. “Track isn’t infinitely strong, and track displacement isn’t binary. Things don’t run flawless until they hit a certain threshold and then immediately fail,” Wang said.
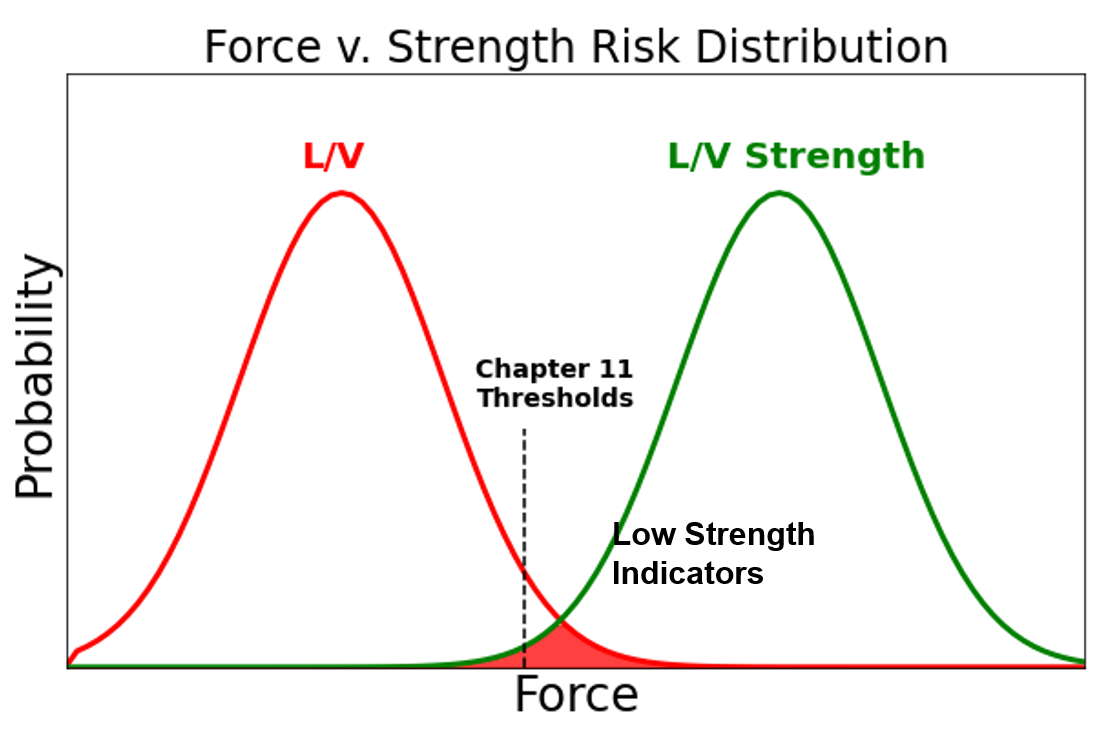
“It’s helpful to think of L/V as part of a force versus strength risk distribution [see Figure 6],” said Stephen Wilk, Principle Investigator at MxV Rail. Ties, fasteners, and components all have a profound effect on the ability of track to resist rail rollover and gage-widening forces imparted by lateral and vertical loads. The danger zone is where the high of L/V forces overlap with the low end of L/V strength. Low L/V strength can take the form of plate cutting, rail seat abrasion, loose spikes, broken fasteners, cracked concrete or composite ties, and thermal bending in composite ties.
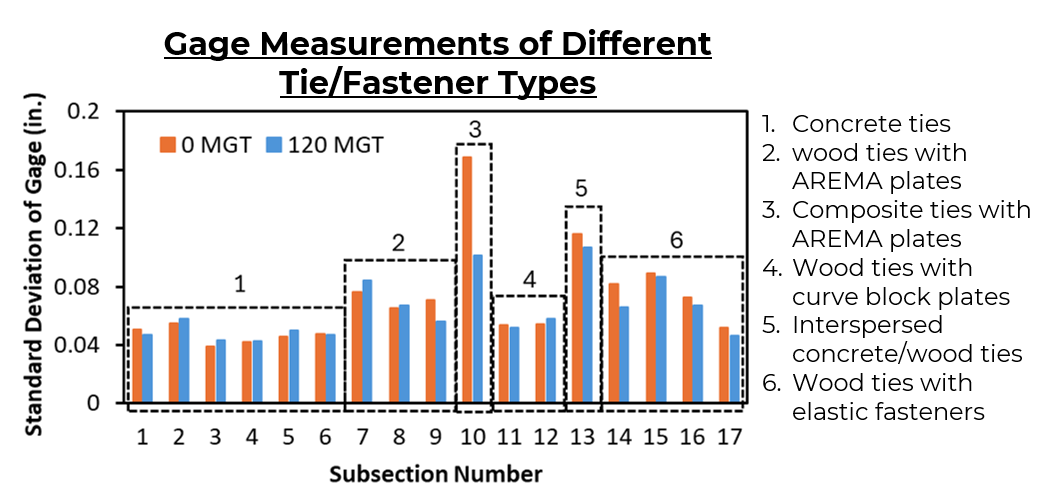
While L/V strength is an important criterion, it’s not something that’s typically directly measured, Wilk said. One of the proxy measurements for L/V strength is the standard deviation of gage. MxV Rail has done some of this research on their FAST track and example results can be seen in Figure 7. “This isn’t going to give you a hard number like L/V, but it does allow for comparisons between various components and fastening systems.”
Net truck L/V, or the resistance of the track to lateral shift, is primarily resisted by the tie/ballast interface strength, Wilk said. Ballast strength is also responsible for resisting track buckling, although in the case of track buckles, longitudinal forces tend to act in concert with lateral and vertical forces to initiate a buckle. Contributors to net truck L/V strength include: recent ballast maintenance, tie and ballast types (ballast grain size and interlock), amount of ballast, longitudinal rail forces, fastener type and condition, anchors, track geometry and/or defects, and curve geometry. “A failure mode involving net truck L/V rarely has a single culprit—it’s typically a combination of factors, and some of them are much harder to measure than others,” Wilk said.
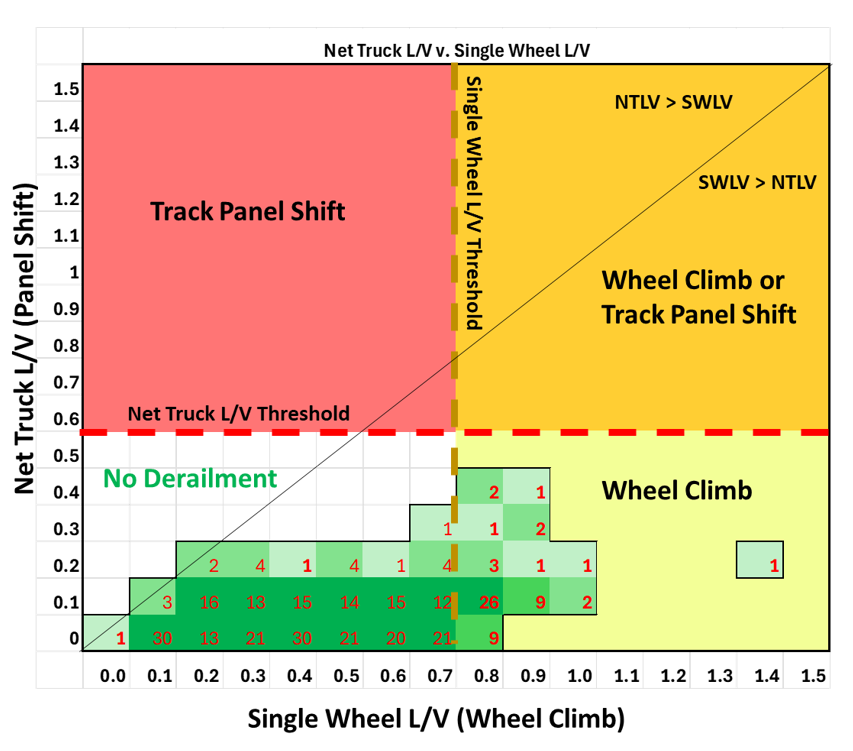
Net truck L/V, as with truckside L/V, is functionally reliant on two components: the unloaded/inherent strength of the track structure and the spikes/fasteners, and the strength of the track system under load, which engages frictional forces as well. “Our goal for this research was to determine what combination of factors and forces is likely to result in panel shift or track misalignment due to net truck L/Vs. “Assuming AAR Chapter 11 thresholds, you’re generally always going to wheel climb before you cause a rail rollover (assuming good track strength), and you’ll get a rail rollover before you get net truck L/V panel shift,” Wilk said. Figure 8, for example, shows an “L/V map” that indicates the possibility of different failure modes based on single wheel L/V and net truck L/V. The green boxes in the chart represent NUCARS simulations and how many of the simulations fall within in potential failure mode. This also helps to visualize why wheel climb tends to be the dominant failure mode as both single wheel and net truck L/V increases.
The different ways that L/V and L/V strength affect the likelihood of derailment make it clear that seemingly simple L/V threshold is anything but. “There are a lot of thresholds, some are a better fit depending on the situation, but I’m not here to tell you that there is one perfect solution,” Wang said. Wheel, rail, track, components, substructure—all these components interact, some more directly and consequentially than others. It’s a good reminder to dig a little deeper into some of the fundamentals that underlie the field of wheel/rail interaction.

Jeff Tuzik is Managing Editor of Interface Journal
This article is based on a presentation made at the 2025 Wheel/Rail Interaction Heavy Haul conference.
Images are courtesy of MxV Rail except where otherwise noted.