Sound Transit Studies Wheel/Rail Interaction Differences Between Vehicle Types
by Jeff Tuzik
Seattle’s Link Light Rail, operated by Sound Transit, is a fairly young system. And by most standards, a small system. But it’s also a sophisticated system, and it’s growing fast. The system currently operates 25 miles of track and is in the midst of expanding to 50 miles over the next two years. The next wave of expansions will take the system to roughly 100 miles in the next 15 years. One of the benefits to operating a (currently) small system that Sound Transit has found, is the ability to more-easily conduct system-wide studies, maintenance, and optimization efforts, and to apply the lessons learned as the system grows.
Sound Transit’s fleet is growing too. The system currently operates two series of vehicles. The Series 1, by Kinkisharyo (KI) and Series 2, by Siemens (SI). The Series 1 KI cars, which entered revenue service in 2009, now number 62 units. The Series 2 SI cars entered revenue service in 2021 and currently number 49, and will number 152 in total by 2025.
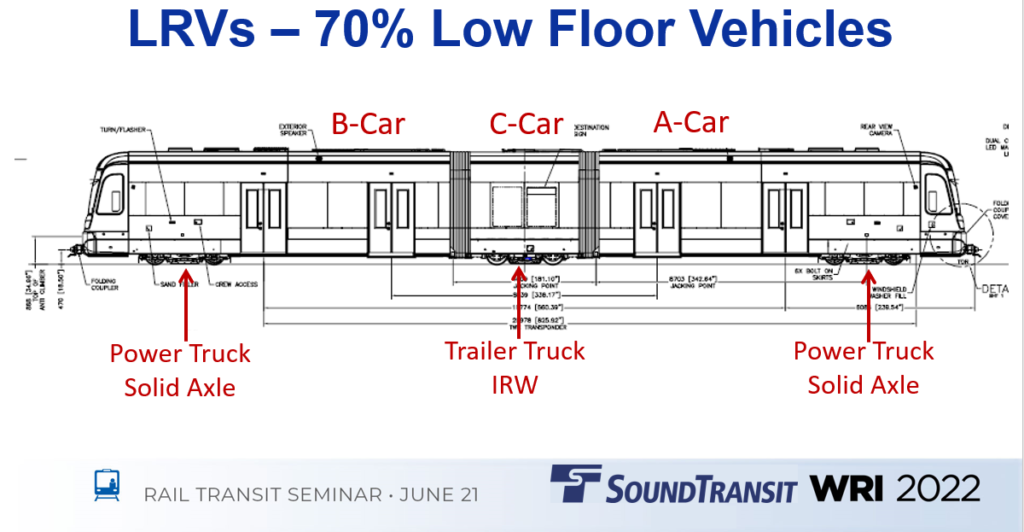
Both series of LRVs are 70% low-floor vehicles. Each consist is made up of an A, B, and C car. The A and B cars have solid-axle, powered trucks, while the center C-car has independently-rotating wheels (IRWs). One notable difference between the KI and SI cars is that the KI uses the Bochum 84LR wheel, while the SI car uses the Bochum 2000 wheel, which have twice the axial rigidity of the Bochum 84. There are also differences in truck suspension and damping systems between the two vehicles.
“When you have different vehicles from different generations running on property at the same time, what will the wheel/rail mechanics look like? Are they different enough to require a different maintenance approach?” Shankar Rajaram, Sound Transit’s Executive Project Director – Vehicles, asked during his presentation at the 2022 Wheel/Rail Interaction Conference.
In order to answer these questions, Sound Transit is currently conducting a study on the different behavioral characteristics of the two car types, with the aim of optimizing the system while the fleets are small, and avoiding surprises down the line. “We want to know how the two LRVs behave now, and how the system will behave as these components age and wear-in,” Rajaram said. The Primary drivers of this study are to:
- Understand (and correct, if need be) the differences in contact band between the two vehicles
- Understand uneven wheel wear and dynamic behavior
- Determine differences in wayside noise and vibration emissions.
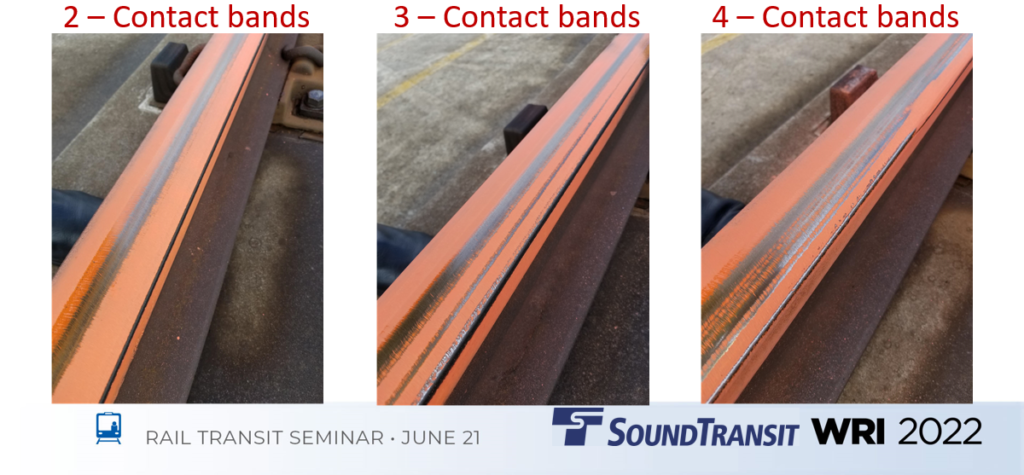
One byproduct of having two different wheel configurations in terms of solid axle and IRWs is that multiple contact bands tend to appear in curves, and the IRWs frequently come into gauge contact. In 2019, Sound Transit, noting that their curves tended to have from 2 to 4 distinct contact bands, conducted a wheel study. The study found that, in general, the IRWs showed heavier flange wear and asymmetric wear, while the solid-axle wheels showed more hollow wear. This study applied only to the KI vehicles, however, as the SI had not yet begun revenue service. “This led us to wonder whether these findings would hold true for both vehicles, and to what degree they differ, if at all,” Rajaram said. As the new cars began to arrive, Sound Transit began to collect data.
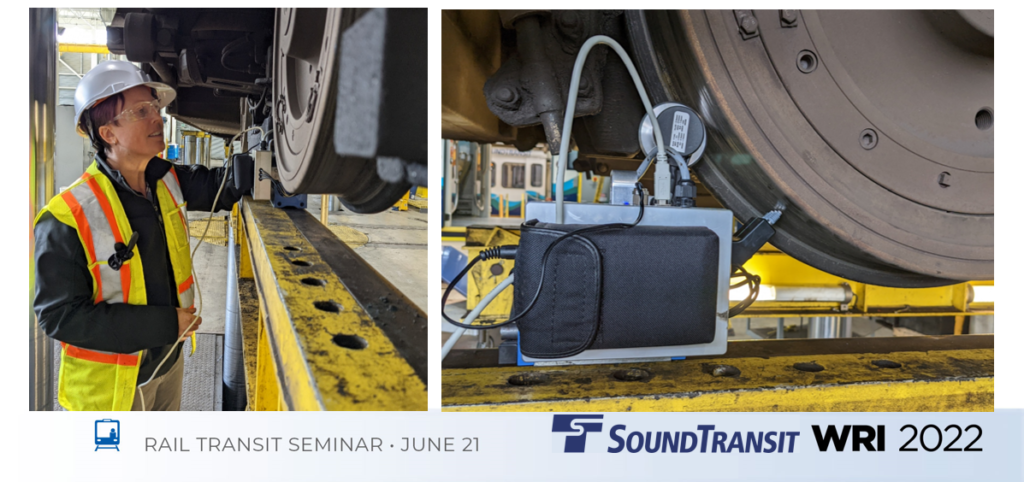
Until recently Sound Transit’s wheel inspection was primarily visual, but they have begun to use wheel surface measurement tools like the Triceratops Wheel Measurement Device to augment their inspections. The manual device measures a wheel and generates data on diameter, corrugation, out-of-roundness, acoustic roughness, and 1/3 octave spectra. When this data is combined with wheel profile measurement data, such as those taken by the MiniProf device, it becomes possible to generate a complete view of wheel condition, Rajaram said.
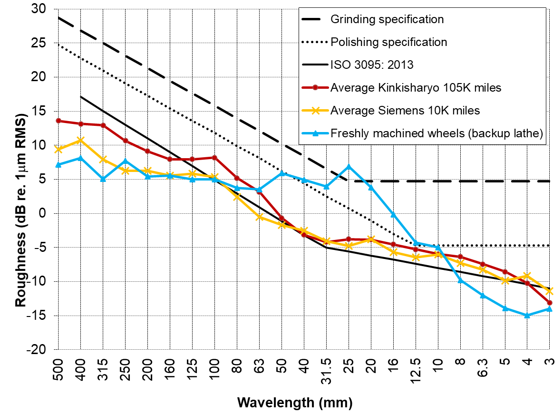
Applying these tools to a sample population of their wheels, Sound Transit compared the performance of worn wheels on the Series 1 and 2, and re-trued wheels. Freshly trued wheels showed a peak roughness (dB re. 1µm RMS) in the 25mm range. Between the KI and SI wheels, their roughness was fairly even below the 50mm wavelength, but above that wavelength, the KI wheels showed higher roughness than both the freshly trued, and the worn SI wheel. “The higher roughness of the Kinkisharyo wheels is likely due to the fact that they have a lot more miles on them and they’ve been through more truing cycles,” Rajaram said. Nonetheless, the data indicates that Kinkisharyo wheels should be noisier.
Preliminary data on relative noise between KI and SI cars bears this out. ST’s findings indicated that:
- The Siemens center car wheel is the quietest.
- The Kinkisharyo center truck wheel is the noisiest.
- The power truck wheels for both vehicles are fairly equal and fall in a range between the Siemens and Kinkisharyo IRWs.
Again, this data comes with a caveat. At Sound Transit, the center truck wheels are re-trued at twice the frequency of the powered car wheels, Rajaram said. Given that the Kinkisharyo vehicles are older, their center truck wheels have been through many more re-truing cycles, likely causing the uptick in roughness at higher wavelengths.
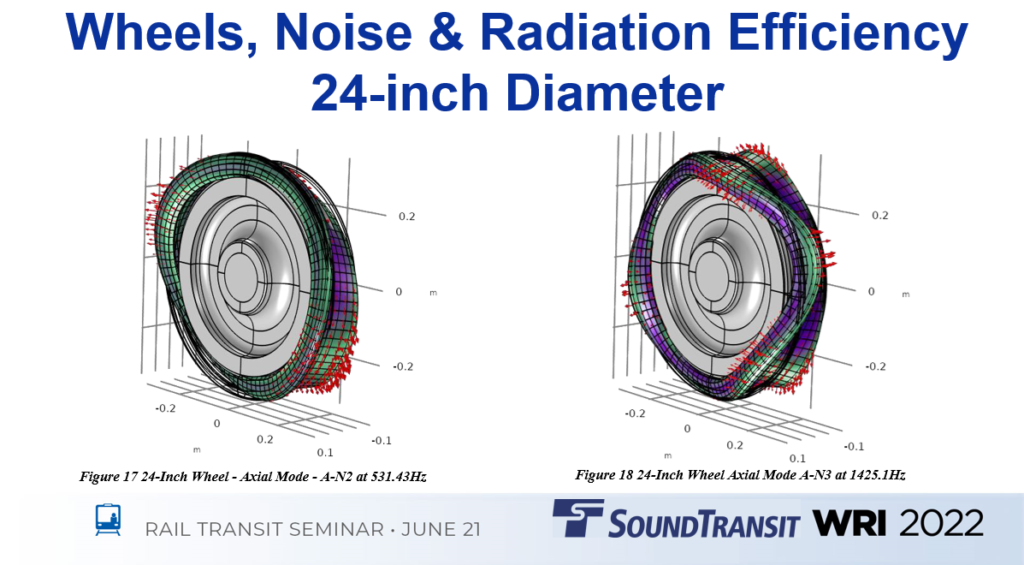
Sound Transit has also begun to explore the differences between the KI’s Bochum 84 wheel and the SI’s Bochum 2000 in terms of noise and radiation efficiency. Through this study, they hope to answer the following questions:
- What are the modal frequencies of the two wheels?
- How is radiation efficiency affected by wheel diameter?
- What effect does track type have on wheel radiation?
Regarding the second point, a new 26-inch diameter wheel should have a different radiation efficiency than a near-condemning 24-inch wheel, Rajaram said. The question then is what effect does this have on emitted noise and vibration?
To answer these questions, Sound Transit developed numerical/physics models of their wheels at varying diameters. The data showed a clear trend that as the diameter decreases, the resonance frequency shifts lower. “These typically still fall within the 3rd octave band, so if that’s your focus you may not see a difference,” Rajaram said. But there may be a point at which the resonance slips out of one 3rd octave band and into another, he added. The fact that behaviors like these are not fully understood indicates a need for further study, but also provides a pathway for further optimization of the system.
To store, corelate, and display all this data and more, Sound Transit uses their OnTrack monitoring database. The database is fed by data collected from various sources and departments and presents an “un-siloed” approach to data management. One of the database’s core uses, thus far, has been to develop a dynamic “noise-map” of the system, which pulls data from onboard sound measurement equipment to pinpoint hotspots and potential problem-areas before they break threshold, so that preventive maintenance actions can be taken. Moving forward, Sound Transit plans to integrate this information with their wheel measurement data and apply the same sort of hotspot detection analysis to their vehicles and wheels.
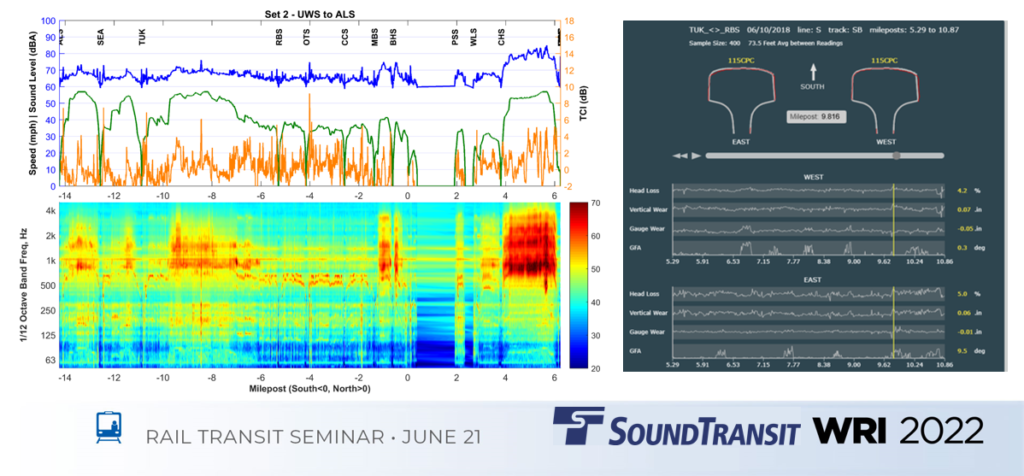
This database has already paid dividends for Sound Transit in terms of real-world problem solving. It was instrumental in determining the cause of excessive vibrations in their highly-sensitive University of Washington underground track section. (See Maintenance Optimization and The State of Good Repair for more information.)
While these kinds of studies can at times seem abstract or difficult to tie to real-world applications, they are in fact critical to building a more holistic understanding of system dynamics and performance, Rajaram said. And ultimately, all this data feeds into a more comprehensive overview of the State of Good Repair. As Sound Transit continues to expand, the data from studies like these, as well as condition monitoring of various assets, will build a knowledge base and a database that will guide future problem-solving and optimization.

This article is based on information presented at WRI 2022.
Jeff Tuzik is Managing Editor of Interface Journal.

