Reducing Broken Rail Derailments in Dark Territory (Part 1 of 2)
By Norman Hooper • January, 2008
This article reflects observations made while serving as Chief Engineer of BC Rail, a Class II railway (now owned by Canadian National) during a period in which the railway reduced service failures and broken rail derailments in dark territory by 60% — an improvement owing to treating the wheel/rail interface as a system, and better managing the risks.
It was four days after Christmas, and the phone rang again. The initial report said that the crew had felt “a bang” on the head-end, then the air dumped before the train got over the spot. An inspection revealed that a rail had broken into seven pieces. Transverse defects (TDs) ranging from small to large were clearly visible. There was double-batter on a couple of the breaks, indicating that the rail had broken up and remained in track as traffic in both directions had gone over it.
In CTC territory, the railway would have been alerted to the failure by the signal system, which is sensitive to broken rails. In signal-less “dark territory,” however, which BC Rail operated in, service failures must be detected by track inspection or train crews. If they are not detected, they are found by a train. The sudden, high-energy nature of a broken rail derailment usually leads to significant costs in vehicle and lading damage, repairs and train delay.
In this case, the required track inspection hadn’t been done. A review of a recent ultrasonic inspection showed defect indications at the spacing where the rail had broken up. The defect indications had been cleared by the operator, however, due to surface conditions. It’s disappointing when this happens, but it isn’t a unique occurrence in the heavy-haul business. Still, in this case, the rail break likely would have been found if the required track inspection had been done.
The existing rail had a history of TD problems and was approaching rail-wear limits. Grinding had been skipped the previous summer because the rail was scheduled for change-out. The new rail that had been scheduled the previous fall for the curve where the derailment occurred was sitting on the side of the grade underneath the snow and the wrecked cars.
Canada has temperature extremes, but they’re not much different from those in the Dakotas, the mountain country and the U.S. Midwest. When the cold weather came, it came in a hurry dropping by 50 degrees F in a couple of days. This was the second broken rail derailment between Christmas and New Year’s that year. The first one was 200 miles north and had been a rail that shattered out of a Flash-butt (FB) weld. There were eight other broken rails that surfaced over a period of three or four days and they were all in the west rail. We found a seriously out-of-round wheel on the west side of a locomotive that had passed north just before all the trouble.
What could have prevented the wreck? A better question is: What will prevent the next one? Firing the roadmaster for a derailment won’t prevent the next derailment; it just deprives your department of needed experience. In this incident, a number of things could have been done differently to prevent the incident. There were failures in program maintenance, rail testing frequencies/reliability, track inspection compliance, the scheduling of capital work as it related to rail wear limits, defective wheel removal, etc. We weren’t managing our risks and we weren’t managing the wheel/rail interface as a system. When a system is weak, changing out the field personnel won’t change the inevitability of another derailment.
Risk Management
Derailments are system failures — a combination of operating, mechanical and track. Management must probe to understand all areas that contributed to the failure in order to commit the appropriate resources required to make a correction. The practice of assigning responsibility to a single cause code, and the cost to a single department works against system analysis; there is no motive to probe for underlying causes, and other departments will not step up to identify and accept responsibility for their part of the problem.
Risk-management on railways is a matter of evaluating and balancing severity and frequency. Risks vary with the type of railway. A high-speed passenger route has different risks and issues than a low-speed switching line that goes through a town center — sometimes carrying hazmat. These railways must be managed differently. You can’t run a rail inspection car each spring and fall through the territory and say, “I’m done.” You have to analyze the information derived from testing and make the appropriate corrections. This is particularly important on a smaller railway because the loss of service from a major derailment can pose an enterprise risk. Insurance is hard to get, and if you’re not servicing your customers, the business goes away permanently.
Derailments pose significant costs/risks to human/environmental safety, vehicle/lading damage, track repairs, train delay, regulatory intervention and corporate reputation. Derailments and near misses must have a thorough fact-finding-based investigation by well trained track/mechanical/operation teams. Derailment outcomes can vary greatly, so it is helpful to employ risk-management to identify system problems. A formal process should be used to identify safety concerns, technical issues and mitigation strategies. The “formal” aspect is the key. It’s important to get all concerned parties together to discuss what happened, to evaluate and classify the risks and develop mitigation strategies. The concerned parties should agree on mitigation process, establish numbers/targets and goals, then monitor the outcomes and trends with Key Performance Indicators (KPI’s), such as the number of broken rails, Undesired Emergency Brake Applications (UDE), number of exceed limit of authority, reports of vandalism, etc. (Note that a derailment count is not a KPI; it is an outcome.)
On the former BC Rail, the “Derailment Task Force” consisted of the union presidents, chief engineer, chief mechanical officer, general manager – operations, and chief inspection engineer of the government regulator. Discussions and the exchange of information about the issues were cornerstones of the improvement program. Nobody played “gotcha;” bargaining issues didn’t come to the table. Railway officers’ annual performance measures on derailments were based on company results not individual department cause codes. (Share the gain or share the pain.) Consultants can also provide assistance for railways that do not have the internal experience to organize a Risk Management process.
The First Steps
Changes in Railway management over the past 30 years have complicated the task of gathering and using data. Complicating factors include:
• Territory lengths continue to increase. Available track time continues to decrease. Supervisors spend less time on any one section of track.
• Staff transfer, turnover and retirements have reduced the organizational knowledge on territories. Because there wasn’t much professional hiring in the ‘90s, there is now a shortage of Engineering “bench-strength.”
• The ownership of inspection, testing, capital replacement and maintenance is split in Engineering Departments.
The first step in any risk-management process is reviewing/gathering data. To quote Gary Wolf, President of Rail Sciences, Inc., “In God we trust, all others bring data.” Without gathering data and being able to access it, railway personnel can’t make the best decisions later on. This is a simple concept, but doing it well is difficult. Integrating the data requires discipline in recording and communication.
It’s important to make the best use of available technologies. Are track inspection issues entered into a database or are inspection records buried in stacks of paper or hanging on a wall available for Regulatory review? A stack of paper has low value. The real value of track inspection reports goes beyond the immediate benefit of identifying defects to what can be derived from the data for predictive maintenance. Is there a record of each pull-apart, broken rail, broken weld, broken joint bar, broken compromise bar, etc.? The technology has changed over the past dozen years. Has your railway kept up?
All assets have service lives; some don’t meet expectations. When a compromise joint bar fails, does your database tell you how much tonnage it saw, how many similar other bars have failed over the past five years, which company made them, the tie support conditions, the amount of rail mismatch, welding or slotting damage, etc.? A comprehensive database and trend reporting can keep you ahead of “the curve” and prevent a derailment. In assessing track inspections, it is much more important to review the quality of the track inspection than the pieces of paper verifying its performance. What is missed or omitted from inspection reports can be as important as what’s entered. Field personnel will not take the time to enter all relevant information unless they perceive the process to be of value and use. When performing track inspections with them, review their reports, ask about and respond to the concerns they’ve identified, identify areas that should be in the reports but aren’t.
Rail Testing
A rail inspection contractor can help with essential rail database data fields such as rail weight, location, manufacturer, defect size and type, dates, etc. This information can be integrated with curvature and grade data. Accumulated tonnage, grinding history, rail wear, rate of rail wear, service failures with all details, rails removed from track, weld failures, bar failures and renewals/repairs should also be included in the available information and reports. This effort isn’t a major IT initiative; an Excel workbook will do. The challenge is keeping the office data current and ensuring that the field gathers the data and reports.
Managers must examine the data to forecast testing frequency. This is essential to improved performance. Focus on the hot spots. All railways have areas with “issues” that need to be tested more often. Check for the seasonality of defects. Parts of Canada have very dry, hot summers and extremely cold winters. There are typically more problems in the late fall and winter.
In order to identify trends, railways should monitor defect size compared to tonnage. If the defects are larger (the size of the TDs, the length of the vertical split heads, the length of the bolt hole cracks, etc.) than the last time an area was tested, you’re moving out on the curve. Programs are available to help forecast testing frequency and defect growth; rail testing contractors also have begun to provide support.
On BC Rail, the most important KPI was the number of service failures (all rail, weld and joint failures identified in the field, or as a BRO (Broken) in testing). BC Rail went from more than 100 service failures per year to around 20 per year. It went from more than three wrecks related to rail per year to less than one per year. The key is to treat the cause of every service failure in dark territory as a potential derailment, even though not every one ends up that way. The BC Rail metric started at about 25-1 service failures per rail related derailment and moved up to 40-1 over eight years. The ratio increase was attributed to improved and more comprehensive field data.
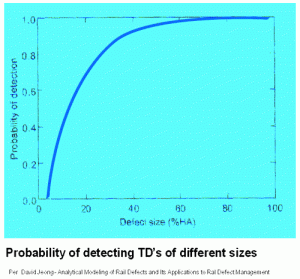
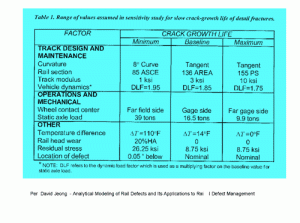
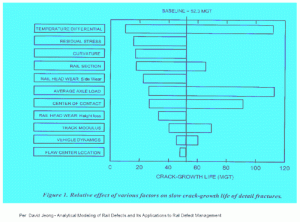
Experience has shown that testing equipment doesn’t always find defects. Research by David Jeong and the Volpe Center on analytical modeling of rail defects is pertinent to rail defect management (see Figures 1, 2 and 3).
(The Volpe Centre has a tremendous body of research relevant to railway field personnel.) As shown in Figure 1, the smaller the defect, the less likely that testing equipment will find it. There are things that can be done in the field, however, to improve the probability of detecting defects. These include cleaning up the rail by grinding or turning down the lubricators prior to testing so that the operators can get a better look. If the rail is greasy or shelled out and the operators are told to eliminate “false-positives,” the net result may be an increase in service failures. AREMA guidelines recommend accuracy of 65% to 95% for rail testing equipment, depending on the size of defects. Accuracy of 65% isn’t great. At this rate, a defect doesn’t have to be very big to result in a service failure in cold weather conditions. Because of this, it pays to clean out small bolt hole cracks and to turn up the gain a bit in order to reduce the risk of a service failure when testing branch lines in dark territory.
It also pays to review the test data where service failures have occurred in order to see how the railway field staff and rail test contractor can improve. Rail testing is art as well as science. There’s a wide range of testing equipment from different contractors and suppliers; some of it may be better suited than others. Operators should be encouraged to assess their findings whenever there is a spike in the number of detected defects. They should be encouraged to ask: “Why are these defects bigger? Why weren’t they caught last time? Relative to the tonnage interval, should we have found them last time?”
In order to reduce the risks associated with defect testing, railways should:
• Have rail testing equipment dedicated as a “first call” to their railway, or own their testing equipment. As a smaller railway, the rail testing contractor came to BC Rail after the big railways had finished their programs. Sometimes, it was too late. This led BC Rail to purchase its own equipment. We paid for it in the first year. While owning the equipment (or sharing it with a few other railways) creates work because of equipment maintenance and operator training/quality, it provides flexibility in being able to vary testing schedules according to risk. Stand-by costs for weather or traffic are much lower as well.
• Test the isolated hot spots more frequently. Particular areas — such as curves in which the number of TDs is increasing, or an area with 85-pound rail in which the tonnage is increasing — should be tested more frequently. You might be testing only 4 track miles of curves on an entire subdivision, but it’s where your troubles are.
• When testing, test hot spot curves in both directions. On BC Rail, we found that we increased the percentage of small TDs that were detected when we turned the equipment around and ran it the other direction.
• In northern areas, it’s wise to perform testing in the late fall and winter. Nobody wants to change defective rail out in December, but service failures on BC Rail typically occurred with the onset of cold weather (and in the early spring). And while changing out rail in the winter is a pain, it’s not as bad as cleaning up a wreck.
Rail and the Service Environment
When David Jeong and the Volpe Center modeled detail fractures, they looked at the growth rate sensitivity of different environmental factors. They examined the effect of a temperature differential of as much as 110 degrees on rail that broke at 52 MGT on average. They examined the effects of wear, contact location and the weight of the rail on defect growth.
Their study showed that crack growth life — the time it takes a defect to grow through 80% of the head — was significantly influenced by temperature. It showed that a rail temperature differential (from neutral) of between 0 degrees F and 110 degrees F could reduce the service life of the rail from 110 MGT to 10 MGT. This is significant on any railway, but particularly on those operating in dark territory. When there is no signal system to warn of a rail break, temperature changes, residual stress, the amount of curvature, the rail type, the axle load, wear, etc., must be taken into account when performing a risk analysis. Railway engineering/maintenance managers also must determine the frequency of testing, the type of rail and rail testing equipment to invest in, and the maintenance practices that are best for their railway.
![]()
This article is based on a presentation made at Interface Journal and Advanced Rail Management’s 13th Annual Wheel/Rail Interaction Seminar, May 2007.
Norman Hooper P.Eng., is Project Engineer, Hatch Mott MacDonald.
References
Jeong, D., “Analytical Modeling of Rail Defects and its Applications to Rail Defect Management,” Volpe National Transportation Systems Center, January 2003.


