Using Wayside Load Detectors for Preventive Vehicle Maintenance (Part 2 of 2)
By B. McGuire, R. Sarunac, R. B. Wiley and P. Klauser • April, 2007
Part 1 of this article examined ways in which the use of vehicle performance detectors is steadily growing on North American freight and high-speed passenger railways. With the installation of a Wayside Wheel/Rail Load Detector on the Washington Metropolitan Area Transit Authority, the trend now extends to the rail transit industry, as well.
The Washington Metropolitan Area Transit Authority (WMATA) engineering staff, working with a team of engineers from Booz Allen Hamilton and the Transportation Technology Center, Inc. (TTCI), installed a Wayside Wheel/Rail Load Detector (WRLD) to assess vehicle performance and identify poorly performing rail cars. WMATA’s primary objective was to characterize the existing fleet by establishing a database of wheel/rail forces. WMATA also wanted to monitor wheel/rail forces on vehicles that have experienced low-speed flange-climb derailments (and thereby decrease the probability of such incidents), establish a baseline of wheel/rail forces for the newest series rail cars, and compare measured wheel/rail forces with modeling and simulation results. A secondary objective was to pinpoint specific defects based upon the vehicle’s dynamic signatures.
WMATA instrumented the high and low rails of a 1,614-foot radius curve without superelevation to measure vertical and lateral wheel forces, as well as axle angles of attack. An Automatic Equipment Identification (AEI) reader was installed at the same location to correlate data with specific vehicles. This allows tracking of individual rail cars, rail cars by series, and the fleet characteristics by rail car series. The WRLD acquisition system automatically collects the date and time of each passing car/train. It also collects vertical and lateral forces for each passing wheel, and the angle of attack of each passing axle. WRLD calculations include (but are not limited to) the speed of each train, the L/V ratio of each passing wheel, the net axle lateral for each axle, the truck side L/V for each passing truck, the axle sum L/V ratio for each passing axle, the average car weight, and the total train weight. Downloadable real-time data from the most recent 2000 trains is stored at the WRLD site. WMATA was most concerned about the system’s ability to identify “troublemakers,” or poorly performing vehicles. Preliminary data analysis and vehicle inspections confirmed that the systems did so.
Data collection begins as the detector determines that a train is approaching. Each wheel produces a force signature that is captured and held until the train passes the site. The force data is captured as medium frequency wave files (25 KHz), which are pre-processed to determine the peak values. These values represent the peak (lateral and vertical) forces that are generated by the wheel as it crosses the strain gauge sensor. AEI tags on the vehicles are read, and the data is merged with the force data to produce a train data set. Both the wave data and train data set are stored in the detector’s master computer.
The data is sent via the Internet to the TTCI for processing and loading into the InteRRIS® system. The data is scanned by an Event-Tracking™ engine to determine if any readings or performance indices have exceeded the established performance thresholds. If so, notifications are sent as e-mail or a direct data feed to the customer’s internal systems.
System Calibration and Vehicle Monitoring
Establishing and generating alarms that identified poorly performing vehicles was critical to gaining maintenance personnel’s confidence in the WRLD’s capabilities. Performance alarms were based on single-wheel, high-rail L/V ratios and the number of occurrences.
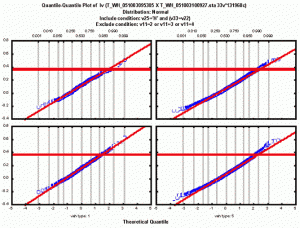
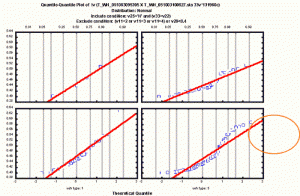
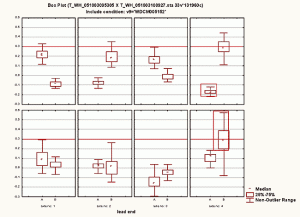
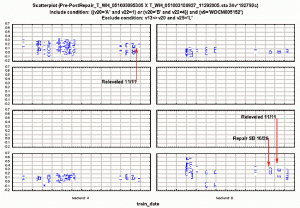
The standard approach to developing alarm or alert levels is to follow an operations research-type analysis of the fleet’s performance data. The purpose is to fully characterize the performance in terms of the attributes of operating conditions, vehicle orientation and vehicle configuration. An exploratory analysis establishes standard descriptive statistics, frequencies and the probability distribution of all performance indices. The usual artifacts include a myriad of frequency and breakdown tables, categorized scatter, box and whisker plots, and categorized histograms (see Figures 1 and 2).
The performance criteria can be based on the distribution extremes found in the performance data or by a known and predetermined limit. A combination of both methods is used at WMATA. A threshold based on distribution extremes would typically look at the 99th or 99.9th percentile. This would be adjusted according to the actual data’s value at these points, along with the expected volume of vehicles that would be flagged by the criteria level. The volume of alerts, and therefore the criterion threshold, must not generate a list of vehicles that exceeds existing resources — either those of the shop personnel or the maintenance facility.
The primary metric monitored at WMATA is the L/V ratio. An 0.40 L/V is characterized as a high-severity hit; an 0.30 L/V is considered a medium-severity hit. A multi-hit criterion is used to eliminate random single readings at these levels and to control the volume of alerted vehicles. Medium- and high-severity alerts are triggered when a wheel records events in 6 of 10 passes over the detector.
Multi-hit criteria are based on data analysis and the results of teardowns and inspections. Experience has shown that repeated and measured poor performance is a sure indicator of vehicles requiring maintenance. Requiring multiple hits at the appropriate (possibly lowered) threshold prioritizes maintenance requirements and controls the volume of vehicles scheduled for maintenance. Further prioritization can identify the “worst of the worst” vehicles and schedule maintenance programs for them.
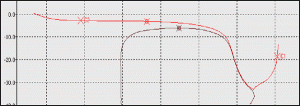
After initial monitoring and data analysis, five vehicles were flagged for performance issues, which included worn wheels, worn side bearings, inadequate car leveling and worn leveling valves, and worn bushings. Certain rail cars exhibited “abnormal” (sharp and high flange) wheel wear at the left side of the R-end truck axles, as shown in Figure 3. Sharp flanges are problematic in that they can interfere with the gauge-face lip on worn rail (see Figure 4), which could lead to a wheel-climb derailment (although no derailment occurred).
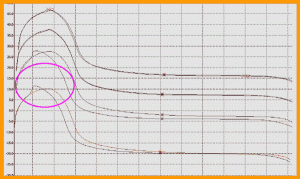
Following corrective actions, the vehicles’ dynamic signatures were monitored to assess the success of each specific repair. Each vehicle’s pre- and post-maintenance dynamic response was analyzed. Figure 5 shows one car’s pre-maintenance dynamic signature in which axle 4 of the R-end truck is in violation of specified criteria. Corrective action included side bearing replacement, re-leveling and wheel re-truing. Maintenance actions were staggered to assess the dynamic signature and impact of each corrective action (see Figure 6).
Fleet Assessment and Impact of New Vehicles
Data collected on WMATA’s existing vehicles provided important information on overall fleet performance. Testing showed that:
• The oldest series (type 1) vehicles experience higher mean and medium single-wheel L/V ratios.
• Overhauled (type 2 and type 3) vehicles experience lower mean and medium single-wheel L/V ratios, regardless of the truck design.
• Trucks on the 1000 and 5000 series vehicles generate lower mean and medium single-wheel L/V ratios than trucks on the 2000 through 4000 series (types 2, 3, and 4) vehicles.
• Vehicle types 4 and 5 generate the highest maximum singe-wheel L/V ratios. Vehicle type 4’s high maximum singe-wheel L/V ratio is due to a midlife overhaul, while the type 5’s high maximum single-wheel L/V ratio is due to high mileage between wheel truing intervals (worn wheels) and car leveling issues.
The dynamic signature of each vehicle series, including the new 6000 series, is being monitored to obtain better insight into the performance of each vehicle type and the condition of the fleet, overall. Beginning with WMATA’s 6000 series rail car procurement, specifications were modified to reduce lateral forces and thereby minimize the potential for flange-climb derailments. Lateral load data was collected on the existing fleet and sorted by vehicle series. L/V ratios (single wheel and high and low rail) were calculated for various percentiles using statistical analysis.
Preventive versus Scheduled Maintenance
WMATA employs a time-based preventative maintenance schedule. Vehicles undergo inspections on a daily, monthly, semi-annual and annual basis. Trucks are scheduled to be overhauled at five-year intervals. Since annual mileage accumulated by these vehicles continues to increase, WMATA is developing a mileage-based equivalent to augment the five-year plan.
Still, scheduled maintenance and repairs are only part of the solution. Technology provides a more effective tool to predict failures and plan maintenance. Preventive or proactive condition-based maintenance can help WMATA and other transit systems operate at peak capacity by reducing component failures, minimizing out-of-service time, and reducing stress on the infrastructure. Identifying and correcting vehicle-related problems before they become critical can enhance safety, improve operating efficiency, decrease service disruptions and reduce overall (vehicle and track) maintenance costs.
During the testing and calibration phase, the WRLD successfully detected poorly performing vehicles. Poor performance was always associated with component wear and the need for maintenance. Preventive maintenance allowed vehicles to perform according to their design characteristics.
WRLD data has shown that the frequency with which a vehicle passes a detector, the vehicle’s direction of travel and orientation (which end is leading) affect the number of alerts it will generate. Tests showed that vehicles that exhibited somewhat high L/V ratios in one direction “disappeared” for weeks at a time when operated in a different direction or orientation. WRLD data has also shown that abnormal conditions typically do not exist in isolation. For example, the typical bad actor produced high L/V values on the lead wheel of the lead axle. Sometimes, however, a less severe L/V ratio was found with a large negative or a moderately positive L/V on the mate wheel. This usually indicates some form of warp or radial misalignment of the truck.
In any case, wayside health-monitoring systems provide a reliable way to measure vehicle performance and predict maintenance requirements. Access to real-time data allowed engineers at WMATA to assess vehicle dynamic behavior during acceptance testing. Dynamic signatures were characterized. Poorly performing vehicles and potential “troublemakers” were identified. With this, the potential for wheel-climb derailments was minimized, and overall safety was improved. The potential to migrate from corrective to preventive vehicle maintenance was clearly identified.
![]()
B. McGuire is Quality Assurance Officer in the Quality Assurance Department of System Safety and Risk Management, Washington Metropolitan Area Transit Authority; R. Sarunac is Lead Mechanical Engineer in the Washington, D.C., office of Booz Allen Hamilton; R. B. Wiley is Principal Investigator at the Transportation Technology Center, Inc.; P. Klauser is a Vehicle Dynamics – Engineering Consultant.
Acknowledgements
The authors would like to acknowledge the support and assistance of J. Pringle, T. Consavage, D. Ogunrinde, D. H. Smith and D. George of WMATA, and C. Stuart of Booz Allen Hamilton. Special thanks to A. Coe and M. Hiller of WMATA for providing field assistance and close collaboration in writing this article.
References
5000 Series Rapid Transit Car Technical Specification, WMATA, June 1999.
6000 Series Rapid Transit Car Technical Specification, WMATA, July 2002.
AAR, “Rail Car Train/Track Dynamic Testing,” Report No. P-93-109, March 1993.
Klauser, P., “Curving Performance of WMATA Cars,” February 2005.
Sarunac, R., and Klauser, P., “Effect of Secondary Suspension Air Spring Imbalance on Wheel Climb Derailment Potential,” APTA, Pittsburgh, June 2005.
TTCI, “WMATA Wheel-Rail Interface Study,” October 2005.
Zeta-Tech Associates, “Derailment of Transit Vehicles in Special Trackwork,” Final Report, TCRP, July 1996.

