
Derailment Mitigation at Switches and Turnouts: Three Perspectives
by Jeff Tuzik
A lot of derailments happen at switches and turnouts. Many are low-speed, low-energy derailments that happen in yards and sidings. But they’re still costly and disruptive. Evaluating and optimizing wheel/rail contact conditions at these locations is different than it is on open track. It requires specific tools, specific practices, and specific research.
The relatively complex geometry of switches complicates wheel/rail interaction at these locations. It makes inspecting and assessing the risk of derailment at a switch difficult; so, railroads use various methods to perform these assessments and inspections, from visual inspection to dynamic simulation and modelling. “At BNSF, as on most railroads, we paint the switch points to see what the wheel contact looks like. But that’s just the starting point,” Zach Dombrow, Director of Maintenance-of-Way Research and Field Testing Services at BNSF, told colleagues at the 2025 Wheel Rail Interaction Heavy Haul Conference. Painting switch points is a helpful visualization, but it doesn’t give the full picture of wheel/rail interaction. For that, it’s important to know the wheel profile, as well. And it’s important to have precise measurements.
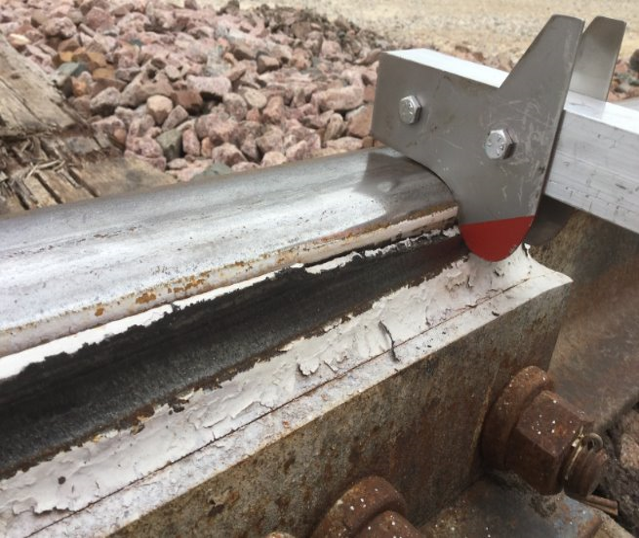
Figure 1 shows a gauge used by BNSF to measure switch- point/wheel-flange contact conditions and to help track inspectors better assess wheel-climb derailment risk. The gauge is marked to show a 60-degree flange-contact angle. If the switch point contacts the wheel below this mark (in the red) it is considered a failure. Other types of switch point gauges are used to assess wheel climb potential based on parameters such as switch point damage, wear on the gage face of the switch point, and switch-point/stock-rail-profile angles.
The gauges used by Dombrow and BNSF were developed as an outgrowth of the 2014 Transportation Research Board (TRB) IDEA (Innovations Deserving Exploratory Analysis) Project 231 (see also Predicting Failure at the Interface for more information). This project—a collaboration between Allan Zarembski (University of Delaware) and Norfolk Southern’s Department of Research and Tests—developed and modified gauges designed to assess wheel-climb-derailment potential for various switch-point and switch-point/wheel-profile-contact conditions. The gauge designs are based on wheel/rail lateral/vertical (L/V) force calculations and provide a simple pass/fail threshold for conditions where L/V forces and wheel/rail/switch geometry are likely to conspire to cause wheel climb.
BNSF later adopted the switch-point/wheel-flange gauge and the vertical-wear-angle (also called gage-face-wear angle) gauge for use on their own system. Dombrow and the BNSF Research and Test group initially used the gauges to measure 150 switches throughout BNSF territory and found that 13% of them met a threshold of concern for wheel-climb risk potential and needed to be addressed; these higher-risk switches were not (and perhaps could not be) detected by track inspectors who lacked gauges. “It’s fair to say that the gauges introduced in the IDEA project have been instrumental in preventing and reducing wheel climb,” Dombrow said.
Guard Rail Climb
Looking past the switch point, wheel-climb derailments can also occur at turnouts due to guard-rail climb. The mechanisms of derailment in these cases are entirely different than wheel climb incidents at the switch point, but the end result is the same: a train on the ground.

Guard-rail-climb derailments tend to share several common factors. They typically occur on the diverging route of a tight turnout. They often involve long, light cars. And the car that derails is typically operating under buff force (compressive force), said Corey Pasta, Scientist at MxV Rail. “There are a lot of guard-rail-derailment mechanisms, but there are three that are particularly relevant to wheel/rail interaction: buff force; angle of the guard rail face; and guard-face-gage and back-to-back wheel spacing.”
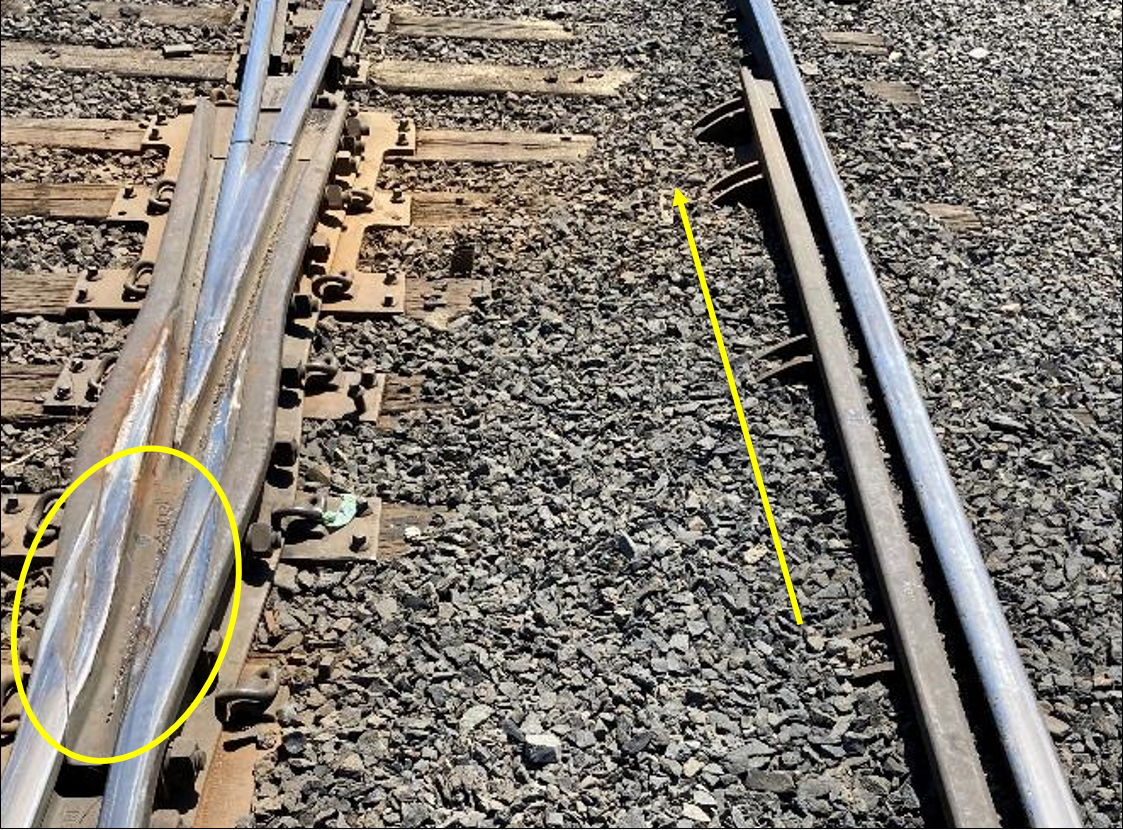
Figure 2 shows the site of a guard-rail-climb derailment. The diverging route is shown in the image, with an arrow indicating the direction of travel. As a vehicle moves through a turnout like this, the left wheel is initially laterally restrained at the flange by the frog, while the right wheel is restrained by the guard rail. Once the left wheel enters the frog throat (circled in yellow) it loses its lateral restraint. “At that point, you’re asking the other wheel, and the guard rail, to protect against lateral movement,” Pasta said. In this scenario, if the car is under buff force, the back side of the front right wheel flange is forced against the guard rail and can, with sufficient lateral force or insufficient vertical force (or both), climb the guard rail.
Mitigating buff force via train handling and yard operations is one way to reduce the L/V ratio, and thus derailment risk, Pasta said. “Maybe this takes the form of a protocol that restricts certain train configurations from being pushed through Number 8 turnouts.” It’s also important to note that buff force is also generated when braking—a car being pulled through a turnout can experience intense buff force during a sudden stop, and depending on the car configuration and coupler angles involved, this too can cause the L/V to reach a critical threshold.
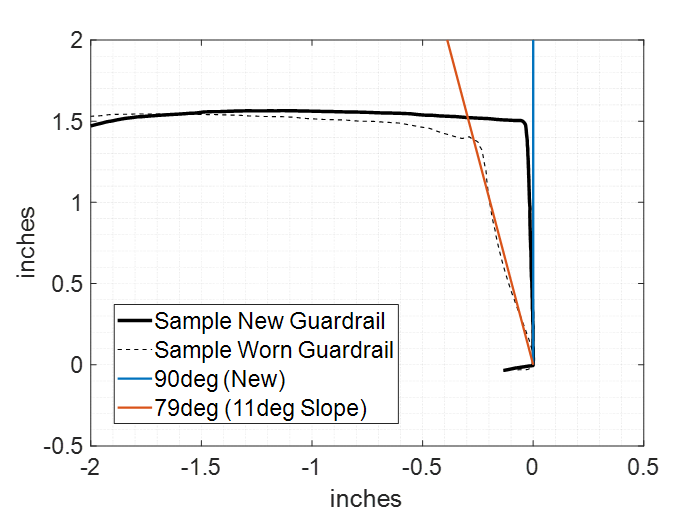
The angle of the guard-rail face in relation to the back of the wheel flange affects the L/V ratio in a guard-rail/wheel-climb scenario just as it does in a “traditional” wheel-climb derailment. “There’s less of an angle on the back of the wheel flange than there is on the front,” Pasta said, so small changes to the guard- rail-face angle add up quickly. Figure 3 shows an example of a new guard rail (solid line) superimposed with a worn guard rail (dotted line) for comparison. “You want to maintain your guard rail to a near vertical slope.”
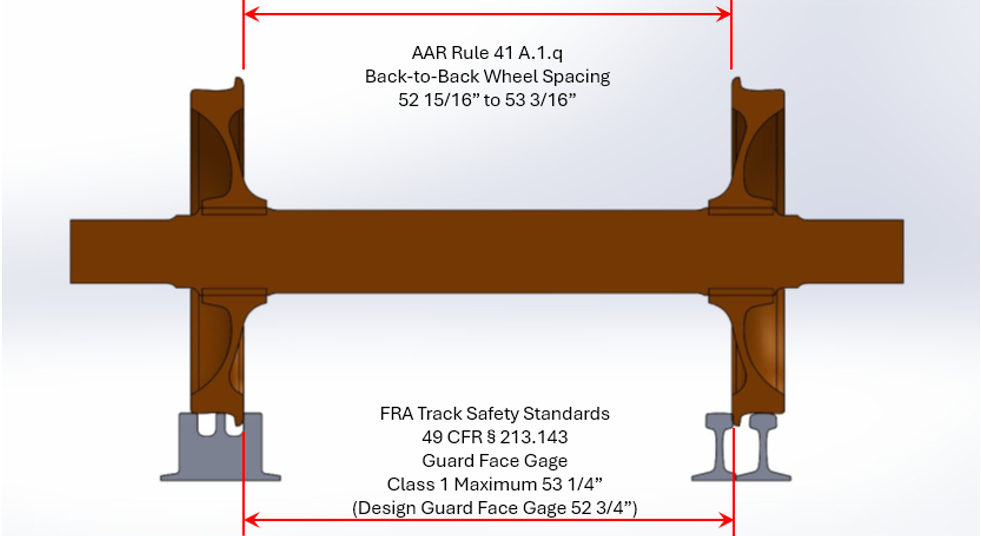
Figure 4 illustrates a proper guard-face gage (the distance from guard-rail face to frog-wing face) and back-to-back wheel spacing. If the guard-face gage is too wide or the back-to-back spacing too narrow, either track components will be displaced, or the wheelset will climb the guard rail, or both will occur, Pasta said. “Guard-face gage is a measurement that’s probably overlooked when it comes to derailments at guard rails.”
Wheel Profile and Picked Switches
Picked- or split-switch-point derailments occur when the wheel flange slides between the stock rail and the switch point. Many factors can contribute to a picked point (see Switch Point Derailments: Is it the Point or the Wheel? for additional information) but wheel flange shape and switch condition are chief among them. A recent and ongoing study by MxV Rail (on behalf of the AAR’s Strategic Research Initiative) looked specifically at the wheel-flange-tip radius and metal flow and their contribution to picked point derailment risk.
International standards vary, but there is currently no North American standard or limit on flange-tip radius. The British standard, for example, sets the limit for flange-tip radius at no less than 5 mm, said Ulrich Spangenberg, Principal Investigator at MxV Rail. As this radius decreases, the flange tip becomes “sharper” and thus, theoretically, more likely to pick a switch point.
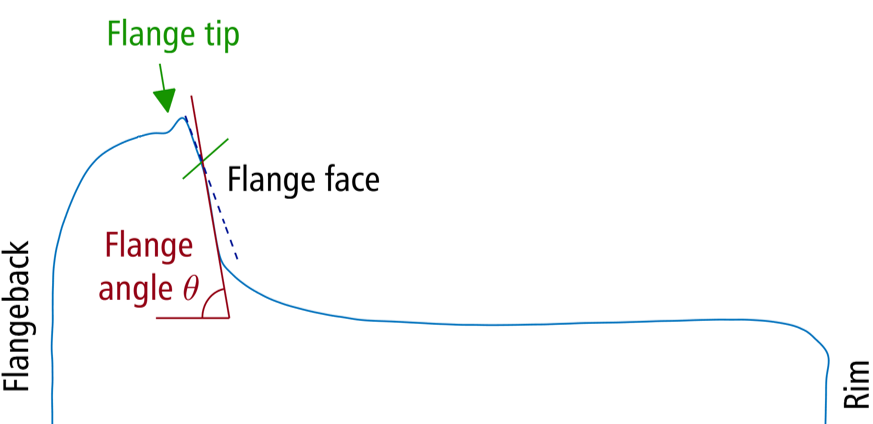
To get a sense of flange-tip flow/flange-tip radii in the U.S., MxV interrogated a database of roughly 300,000 measured wheel profiles provided by AAR members. “We were curious to see how many of our wheels would exceed the British standard,” Spangenberg said. MxV also calculated the maximum flange angle for the wheels. They found a peculiarity in the data, in that many of the wheels with flange-tip flow also had a bilinear flange angle, meaning that the flange angle was in fact two different angles (the green line in Figure 5 marks the flange angle flexion point in one example).
Of the ≈300,000 profiles, MxV determined that 6.8% would be condemnable by British standards. Of this population, they identified nine with a flange-tip radius of <2.5 mm and a maximum flange angle of >77.5 degrees—a combination of parameters thought to be most conducive to picking a switch point. These wheels were then modeled using NUCARS (modelling and simulation software) with each of the nine wheels as a lead wheel on an unloaded hopper car, Spangenberg said. “We wanted to determine wheelset attitude as it approached the switch point.” Specifically, the aim was to determine wheelset lateral displacement and angle of attack to study wheel/rail/switch-point-contact conditions in three dimensions. The switch used in the simulations was a CAD model of a Samson point switch.
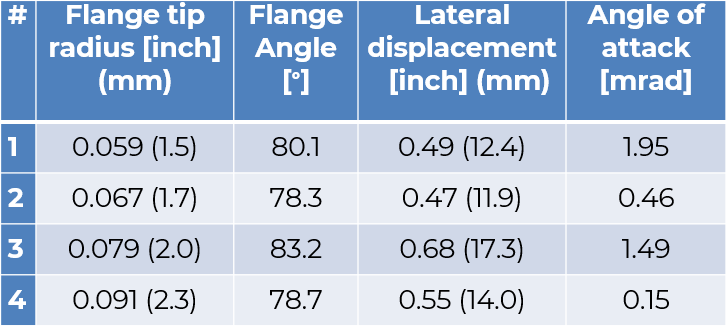
Figure 6 shows simulation results from four of the nine wheels. “The typical clearance [lateral displacement] between the wheel-flange face and the gage face is 11.7 mm,” Spangenberg said. In the NUCARS simulations, lateral displacement exceeded the 11.7-mm figure in all cases, ranging from 11.9 to 17.3 mm. This is the result of flange wear (a thinner flange allows for more displacement) and the fact that the modelled wheel tended to offset and hug the stock rail, he said. The angles of attack from the simulation range from 0.15 mrad to 1.95 mrad. These figures are typical of a wheelset negotiating a 1- to 2-degree curve, Spangenberg said—not excessive, but enough to point the modelled flange tip toward the switch point.
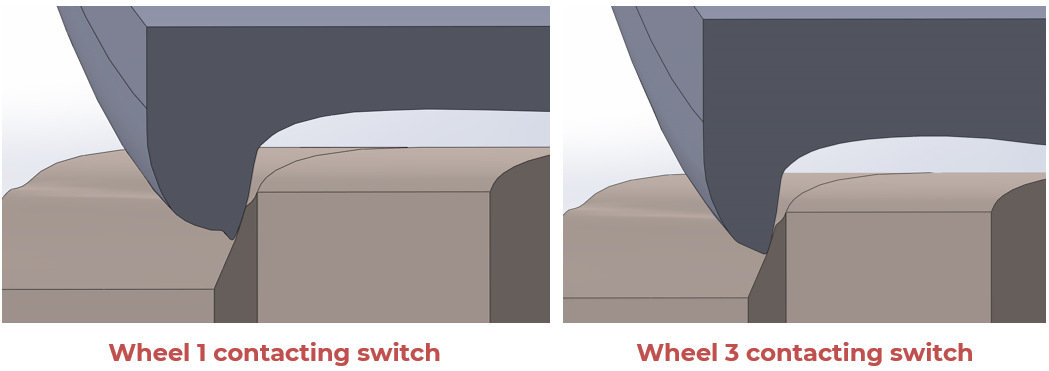
Figure 7 shows a detail of flange-tip/switch-point interaction from CAD analysis of wheels 1 and 3 from Figure 6. In both cases (in all nine cases, in fact), the wheel-flange-contact point preceded the wheel-tread-contact point (due to the angle of attack) in the direction of travel. However, none of the wheels were able to pick the switch point in simulation. “We couldn’t identify any particular wheel profile that had a bigger derailment risk in terms of switch picking,” Spangenberg said. It’s important to note that the switch point used in the model was in perfect condition. “Wheels with a small flange-tip-radius may increase the likelihood of a picked switch if the switch is poorly maintained, out of adjustment, or chipped or broken.”
The next step of this study is to incorporate lateral and vertical forces into the model, which will allow MxV to determine whether small flange-tip-radius wheels contribute to wheel-climb derailment risk at the switch point. “We also want to look at the TRB IDEA gauges and see how those measurements compare to our findings,” Spangenberg said. “This is part of an effort to give the industry more objective assessment tools for switch-point inspection and evaluation.”

Jeff Tuzik is Managing Editor of Interface Journal
This article is based on a presentation made at the 2025 Wheel/Rail Interaction Heavy Haul conference.
Images are courtesy of BNSF and MxV Rail except where otherwise noted.