
Simulation and Digital Twins: A System-Based Approach to Predictive Maintenance
by Jeff Tuzik

Rail transit systems collect a lot of data. This is data collected from many sources—wheels, rail, track, and vehicles—and from many types of measurement devices. Some of the data must be collected per regulatory requirements, but much of it is collected because it’s valuable. Transit systems use data to identify wear and degradation trends over time and into the future to schedule and perform proactive maintenance. Data can also be leveraged to create a dynamic simulation of an entire system—a digital twin—which can provide predictive insight at a systemic level.
A digital twin is exactly that, a simulation of a process or system based on measurements of the thing itself. As such, the quality, granularity, and veracity of a digital twin is dependent on the quality of the input data. “In the rail industry, we’re integrating more and more data streams into digital twins and simulations to make them better representations of the physical world,” Cory Hogan, Director of Vehicle Dynamics Studies at ENSCO, told colleagues at the 2025 Wheel/Rail Interaction Rail Transit Conference. The purpose of a digital twin is to predict problems, evaluate alternatives, and to help guide decision making and optimization, he said.
The early generations of digital twins that ENSCO developed were based on fewer data streams—typically track geometry data combined with models of vehicle and truck types, based on system specifications, Hogan said. These simulations were useful in modelling vehicle/track interaction and derailment risk, generally. But with so few data streams, the simulations didn’t fully represent the physical system. The current generation of digital twins now also includes wheel and rail profile data, as well as more sophisticated vehicle/track interaction modelling.
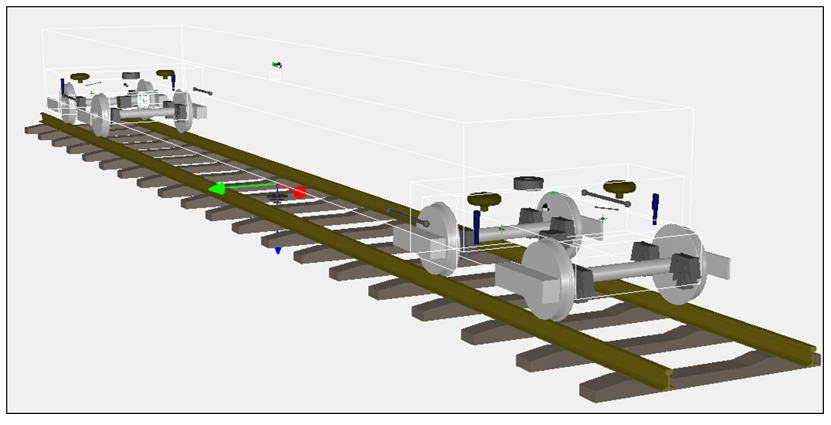
The VAMPIRE (Vehicle Analysis Modeling Package In the Railroad Environment) software package is widely used in the rail transit and heavy haul industries, and by researchers and academics. It’s a multi-body vehicle dynamics modelling package (see Figure 1) that simulates vehicle performance primarily for the purposes of car design evaluation, accident investigation, and vehicle/track interaction studies (based on track geometry data). ENSCO recently acquired VAMPIRE’s source code, allowing it to develop new iterations of the package with modified and expanded capabilities.
VAMPIRE itself isn’t new, it dates back to the late 1980s and is the result of collaboration between Delta Rail, AEA Technology Rail, and British Rail Research. But the ability to integrate the modelling package with actual wheel and rail profile data is a recent development. “For a long time, we had the [wheel and rail] profile data on one side, and dynamic vehicle modelling and track geometry data on the other. But we didn’t really have the digital infrastructure in place to integrate the two,” Hogan said. That infrastructure is now in place; VAMPIRE simulations can now incorporate wheel and rail profile data, track geometry data, and multibody vehicle modelling. This results in a simulation that more accurately reflects the physical system. “You always want to reduce assumptions and guesswork in a digital twin, and you can only do that by bringing in more real-world measurements,” Hogan said.
Improvements in measurement technology, data transmission, and data processing have also been critical to the improvements in digital twin/simulation capabilities. “When I first started in simulation development, the data we got arrived by ‘bucket-brigade,’” Hogan said. “We’d get the track geometry data eventually, then we’d have to talk to a different department to get vehicle data, and yet another to get rail profile data. We rarely got any wheel profile data.” As a result, it often took several weeks to perform simulations of specific vehicle/track dynamics (as part of a derailment investigation, for example). “That data all existed before the derailment occurred, but at the time, there was no good way to bring all this data together and use it in a predictive manner.”
Advances in cellular data transmission, the advent of cloud computing, and the ability (and the will) to feed multiple disparate data streams into a single repository have allowed simulation and predictive analysis to flourish.
As measurement technologies have advanced, and continue to advance, so too have digital twins. In-track wheel-profile measurement devices, positioned strategically in a yard, can easily measure every wheel in a fleet, every day. Wheel profile and track geometry systems can collect data at very high resolution—the only limiting factor in measurement interval is the practicality, from a maintenance standpoint, of measuring at extremely small intervals, and the huge amount of data such a practice would produce. There are also various vehicle- and truck-mounted measurement technologies capable of providing continuous measurement of parameters like carbody accelerations, noise and vibration, and rail profile measurement.
Digital Twin: A System-Based Approach
Trending measurement data in support of maintenance planning, system optimization, capital planning, etc., is a ubiquitous practice, and an effective practice. This kind of predictive maintenance has a long and proven history of efficacy. So, where do digital twins and simulation fit into the picture? According to Hogan, the power of the digital twin lies in its integration of data streams. Digital twins excel at identifying patterns and risks that occur at the system level due to the interaction of multiple sub-systems. Simulations are valuable tools for four key reasons, he said. They can:
- predict hidden system risks that occur below maintenance limits
- calculate parameters that are difficult to measure on a system-wide basis, such as derailment risk and passenger comfort (ISO 2631)
- evaluate the effects of “what-if” scenarios that would be infeasible to test: extending wheel reprofiling intervals, for example, or extending rail grinding cycles
- evaluate the effects of numerous variables to determine the most efficient/cost-effective application of maintenance dollars
“You might look at your track, and everything looks good, then look at your wheels, and everything looks good, then look at your vehicles and everything looks good. But put it all together and you’ve got a problem somewhere,” he said. In other words, digital twins can help find elusive deleterious interactions that may otherwise get lost in the noise.
Digital Twin Applications: 1
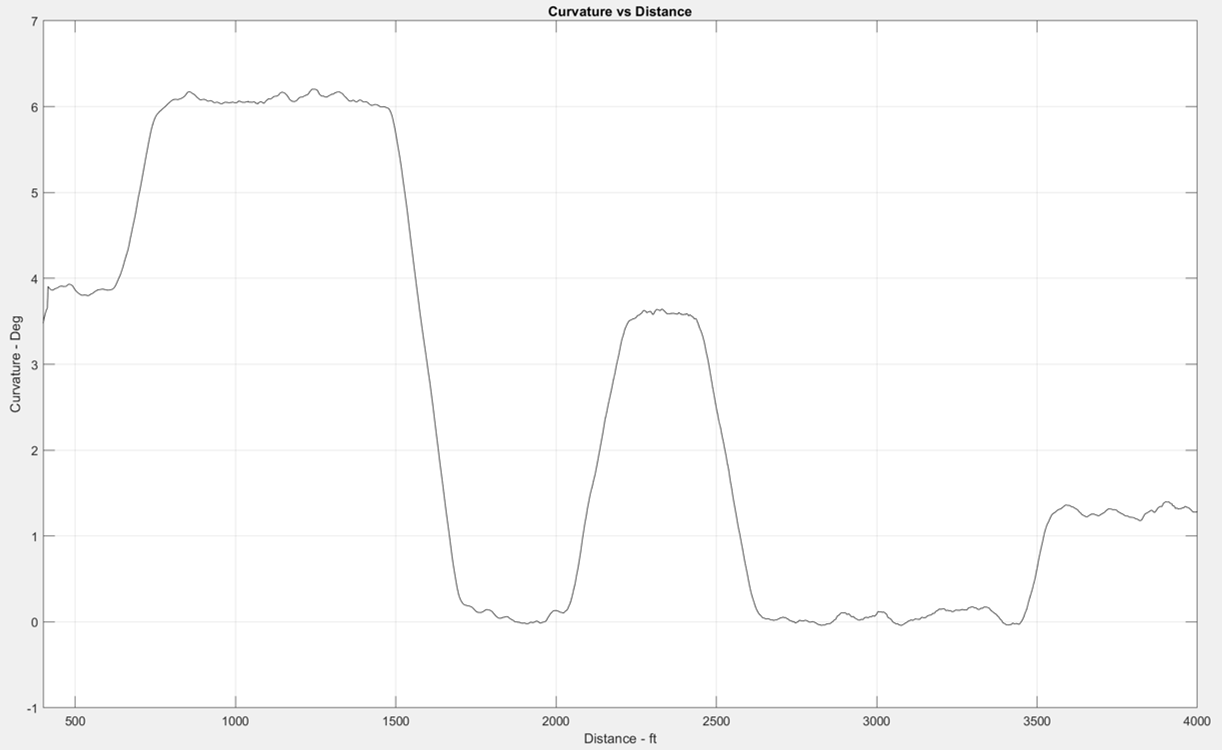
One example of leveraging the capabilities of a digital twin (and other simulations) concerns an ongoing comfort and safety analysis at a North American transit system. Figure 2 shows track geometry data from one section of track on the system. It shows a series of three right-hand curves (≈6 degrees, ≈3.5 degrees, ≈1.3 degrees). All maintenance limits at the site are within spec, Hogan said.
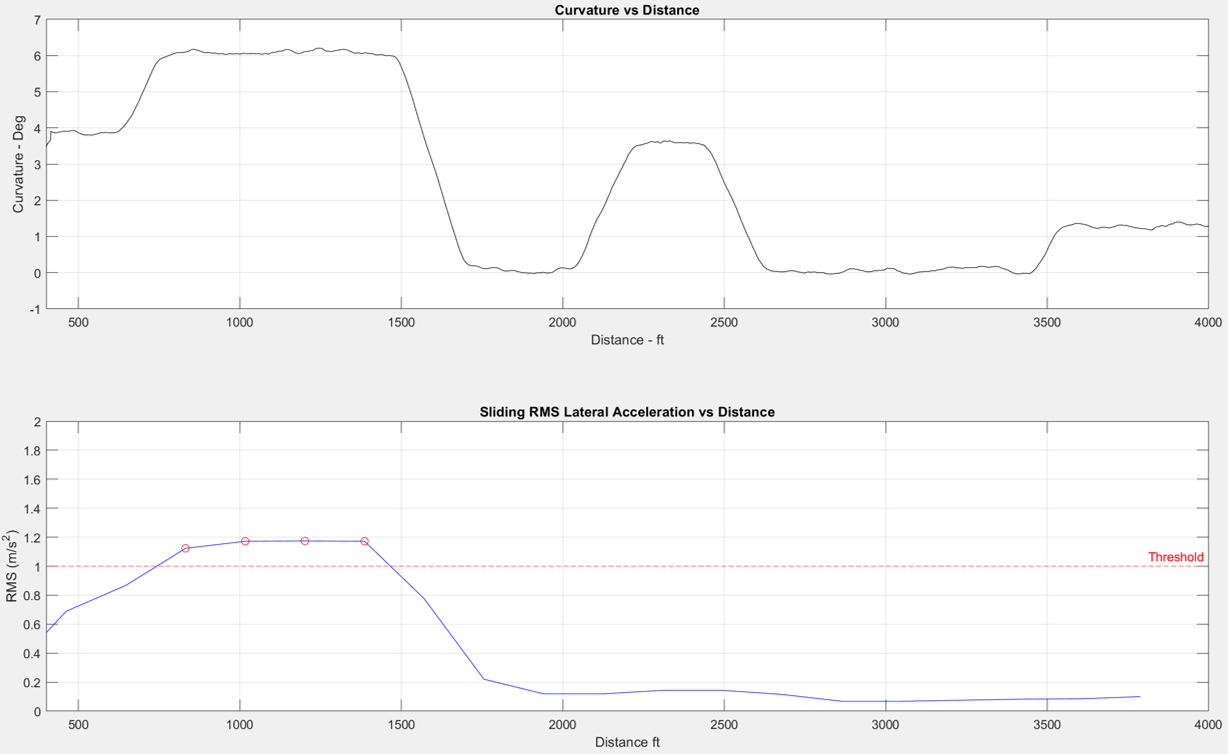
Based on track geometry data, wheel and rail profile data, and vehicle technical specs, ENSCO used a digital twin to model ride quality, equivalent conicity, and L/V ratios of the high rail wheel of the lead axle. Ride quality outputs, in this case, were determined by measuring (within the simulation)
lateral accelerations, with an “uncomfortable” threshold of 1 m/s2 (ISO 2631). Figure 3 shows the results of the simulation. There are several slight exceedances throughout the 6-degree curve, but everything else is well below the threshold.
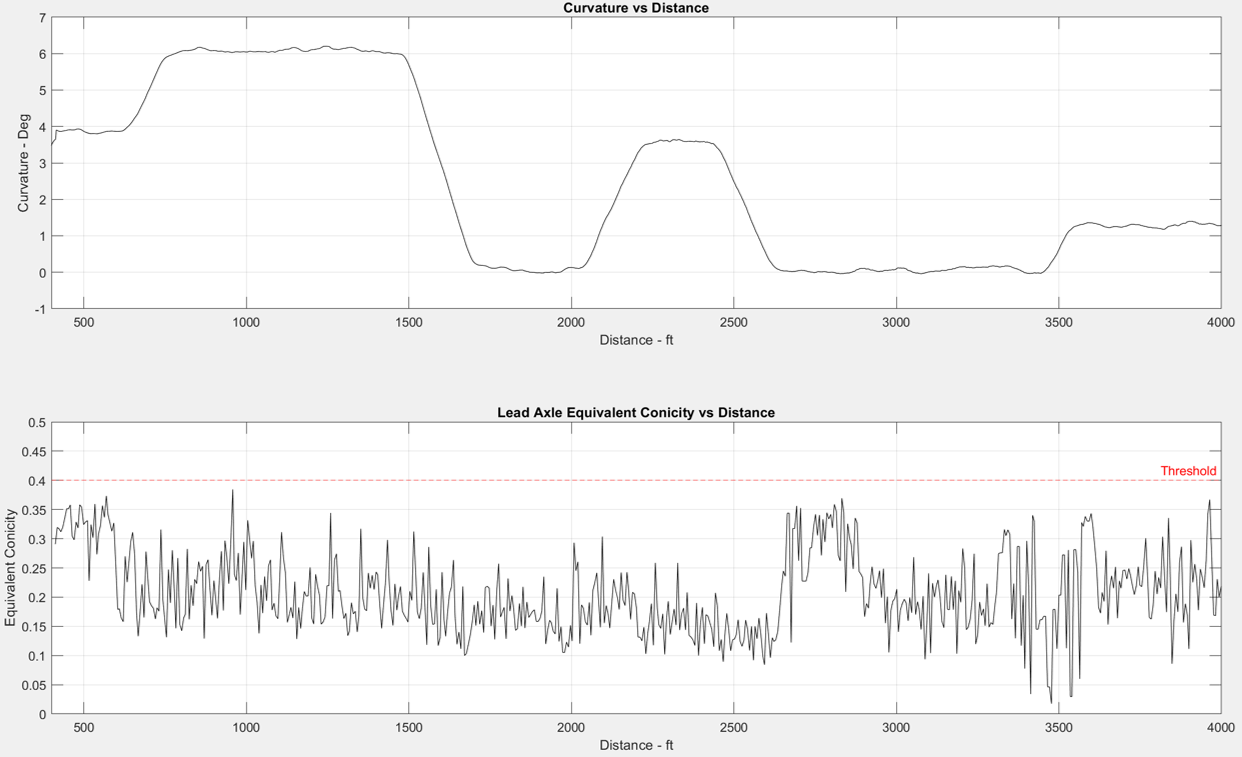
Equivalent conicity, which is a measurement of the rolling radius difference between a pair of wheels at a specific point on the track, quantifies a wheelset’s self-steering tendency and stability (at that point on the track). Figure 4 shows the simulated equivalent conicity for the lead axle. The threshold, ≈0.4, is based on industry recommendations for this type of transit system. In this case, the lead axle doesn’t exceed the threshold, but it comes closest in the 6-degree curve. This could indicate high flange forces and generally poor steering in curves, Hogan said. “This is equivalent conicity data for only one axle, but in the world of simulation, it’s easy to apply this to any axle, or the entire fleet. And thanks to cloud-based parallel computing, these kinds of simulations can be done very quickly.”
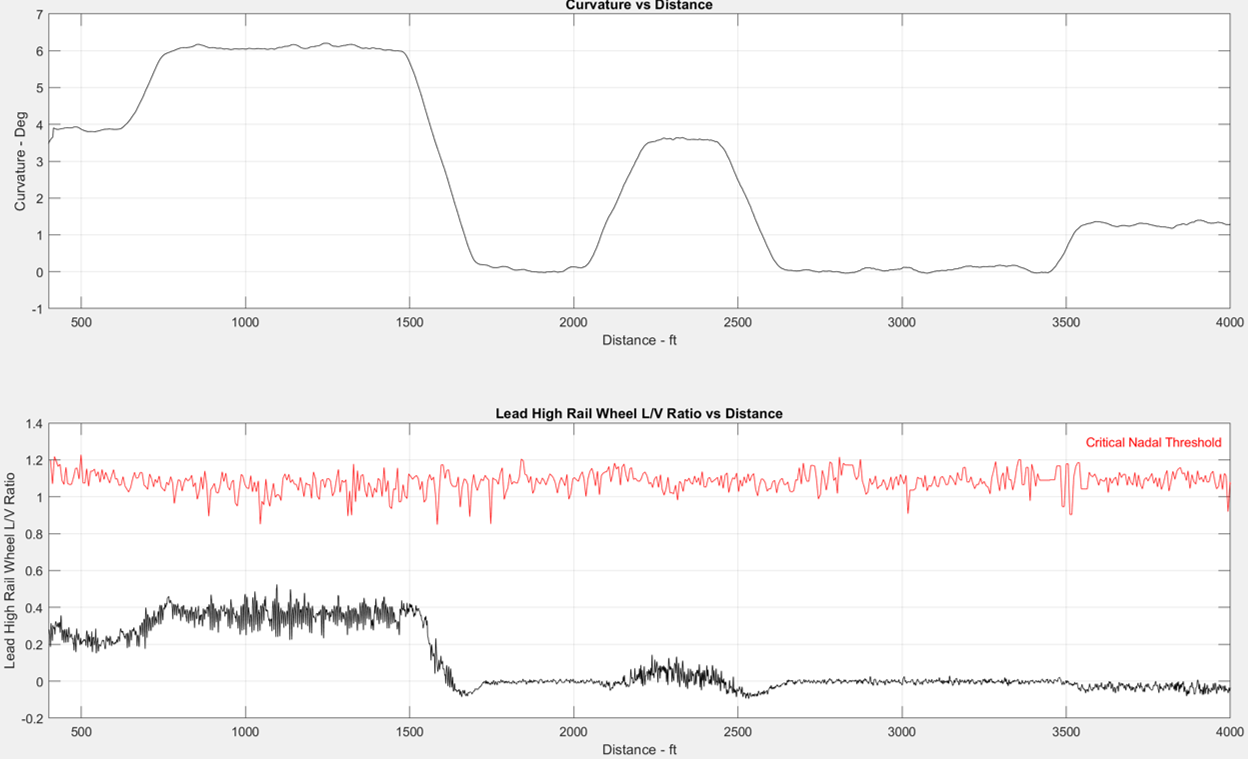
The ratio of lateral/vertical forces at the wheel/rail interface is an important metric in calculating wheel-climb potential and thus derailment risk. L/V forces are based on many factors, including wheel-flange-contact angle (which itself is based on wheel and rail profile), coefficient of friction between the wheel flange the gage face of the rail, track geometry, and vehicle/track dynamics like suspension stiffness and damping. Given the number of interacting variables, fleet-wide and network-wide wheel L/V ratios are more practical to evaluate through simulation than direct measurement. Hogan said.
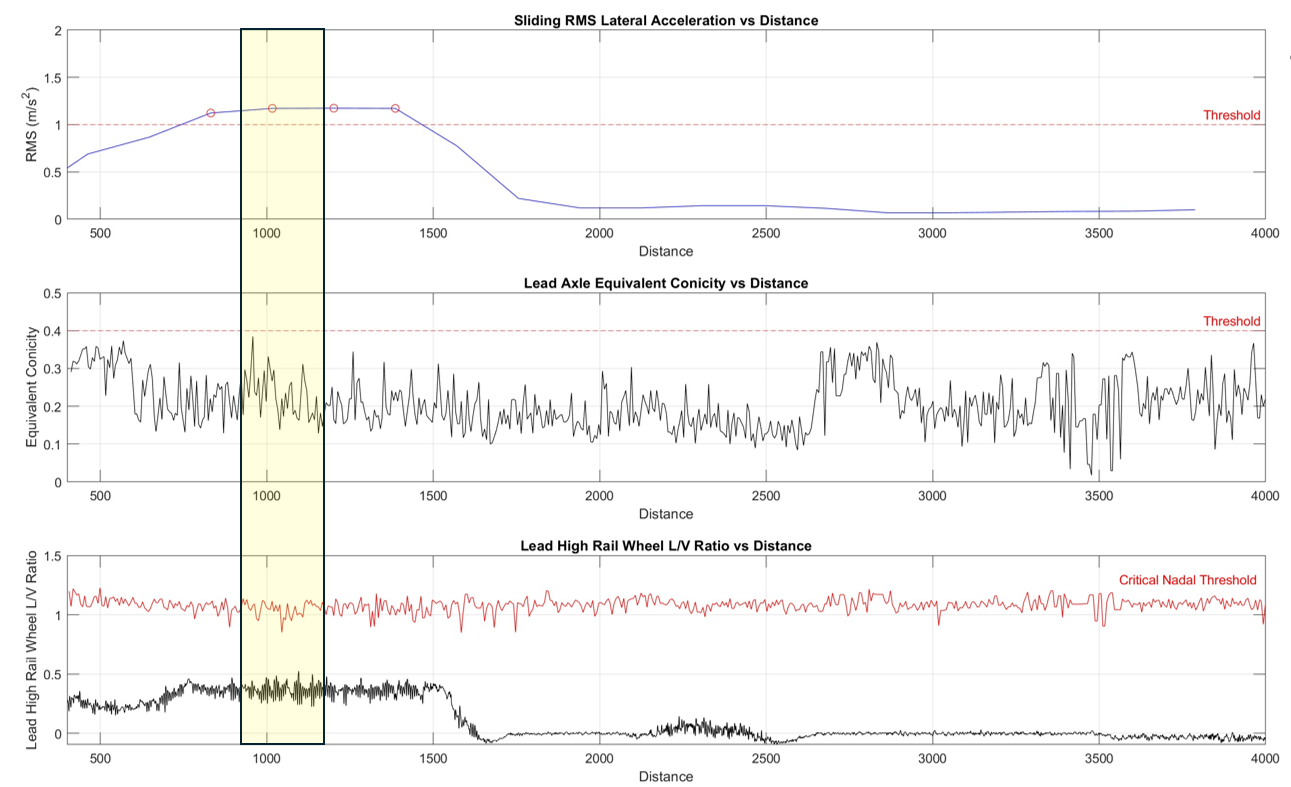
Figure 5 shows simulation data for the lead axle high rail wheel. Note that the Nadal critical threshold varies because it is a function of wheel/rail contact conditions, so the actual L/V ratio required to exceed the threshold changes as those conditions change. At this location, L/Vs for this wheel are well below the threshold, but clearly elevated through the 6-degree curve; another possible indication of poor steering and heavy flange contact, Hogan said.
Figure 6 shows a cross reference of all simulation outputs for the site. By aligning the simulations, a clear pattern emerges of potential issues in the 6-degree curve. Not an immediate risk, but perhaps a location to keep an eye on.
Digital Twin Applications: 2
Simulation is particularly useful in modelling how specific changes will affect the overall system. This kind of testing, depending on the change, is either difficult or impossible to do on the physical system. In this way, simulation can help to optimize maintenance actions by determining which action delivers the most bang for the buck, Hogan said.
In this example, the target is rolling contact fatigue (RCF) at the same transit system and same location as in the first example. RCF clusters were found throughout the longer tangent section between the (≈3.5-degree and ≈1.3-degree curves) and have been found to re-develop shortly after rail grinding, Hogan said. The transit property asked ENSCO to investigate the underlying causes and the primary damage mechanism driving RCF at this section of tangent track.
The ENSCO team ran a pummeling analysis, again using all the data they’d previously collected (wheel profile, rail profile, track geometry data, and vehicle characteristics). A pummeling analysis simulates wheel/rail contact cycles (i.e. passes through the tangent section) under static and dynamic vehicle loading. “The [pummeling] analysis allows you to run hundreds to thousands of simulations to see what happens to [RCF development] if we change the wheel profile, or the rail profile, or both—or what happens if we fix the track geometry.” The aim is to find which factor contributes the most to RCF on the target track section.
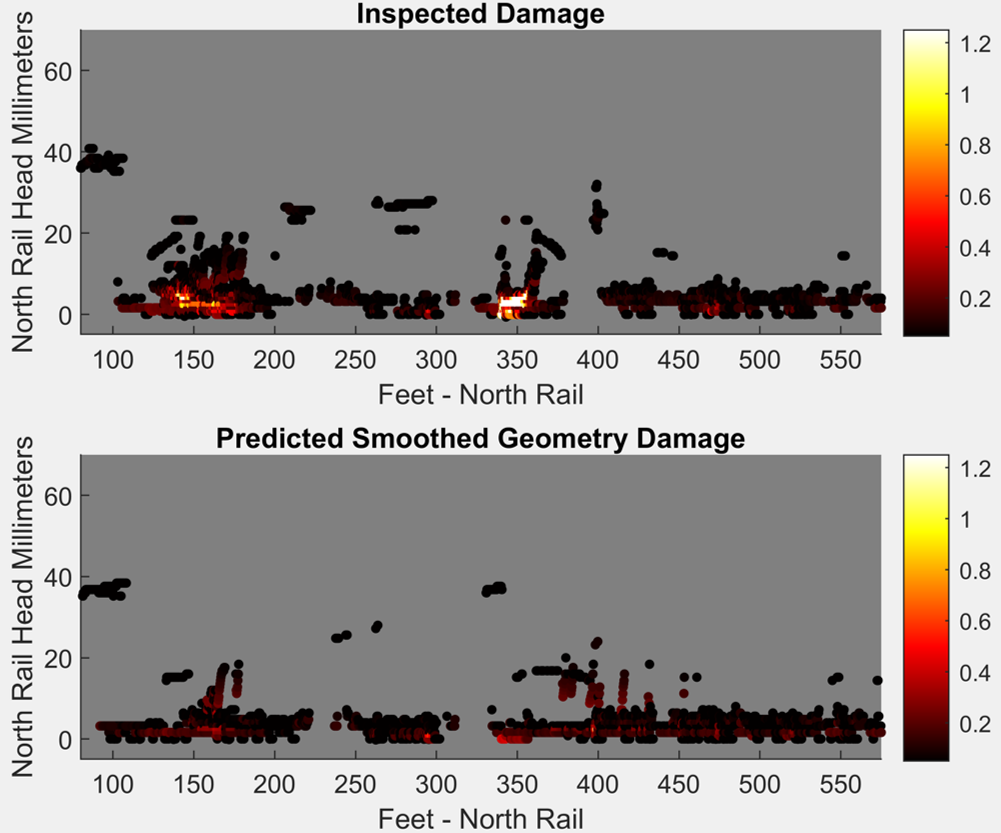
Figure 7 shows the results from an iteration of the pummeling analysis; the top graph shows a simulation of track damage severity in the tangent section in its measured state, without any changes. The bottom graph shows a simulation of track damage severity if track geometry were improved. Note that there were no track geometry defects in the tangent section, but this doesn’t mean that the geometry was optimal, Hogan said. Out of all iterations of the pummeling analysis, track geometry optimization had the largest individual effect on damage severity. “Being able to simulate these “what-if” scenarios can save a lot of time and money. Maybe you don’t have to change your fleet’s wheel profile, maybe you don’t have to change the rail profile to get the results you want.”
As development on simulation/digital twins continues, Hogan said that the plan is to reduce the use of assumptions in simulations, and to incorporate more physical data from more sources, including:
- Data from truck performance detectors (truck-mounted accelerometers) or L/V monitors.
- Before-and-after data from track geometry remediation practices (tamping, ballast renewal, etc.), to better simulate their specific effects.
- Friction data based on measurements and on the development of more sophisticated contact models within the simulation. “Right now we have to make some assumptions based on how far from a lubricator you are, the carry-down rate of the lubricant, and that kind of thing. But if we can get measured data, we can integrate it into the model,” Hogan said.
Modelling and simulation have been part of the wheel/rail and vehicle/track interaction fields for a long time. But they’re getting more sophisticated at an ever-increasing rate. Digital twins can help to pinpoint issues that don’t exist in any single dataset but rather at a system level, where everything is in interaction—this has long been the credo of the wheel/rail interaction specialist. And simulations provide a consequence-free environment to explore the systemic effects of different maintenance or optimization strategies. But, like any other case, good data output is dependent on good data input. And good data output drives good decision making.

Jeff Tuzik is Managing Editor of Interface Journal
This article is based on a presentation made at the 2025 Wheel/Rail Interaction Heavy Haul Conference
All images courtesy of ENSCO unless otherwise noted.