
Vehicle Stability in the Rail Transit Environment
by Jeff Tuzik
Vehicle stability is of paramount concern in the rail transit environment. It affects safety, ride quality, and wear and damage on the track, wheels, trucks, and suspension. In turn, stability is largely defined by the interplay of track characteristics, wheel and rail profiles, and truck and suspension design. Poor stability can have many root causes, but good stability is a sign of a well optimized wheel/rail and vehicle/track system.
The design and specification stage is where the opportunity to address vehicle stability and ride quality begins. Because there is so much variation in transit systems, vehicles are often custom, one-off designs that are unique to a given system or even a specific line, Harry Skoblenick, World Class Engineer, Master Expert – System Design at Alstom, told colleagues at the 2025 Principles of Wheel/Rail Interaction Rail Transit Conference. The vehicle specifications in this context are focused on the wheel, truck, and suspension.
“In addition to providing stability, the truck is also responsible for minimizing the generation of track geometry and rail surface defects, and the transmission of forces from existing track irregularities into the car body,” he said. This is a tall order, and part of the reason for the custom nature of vehicle design.
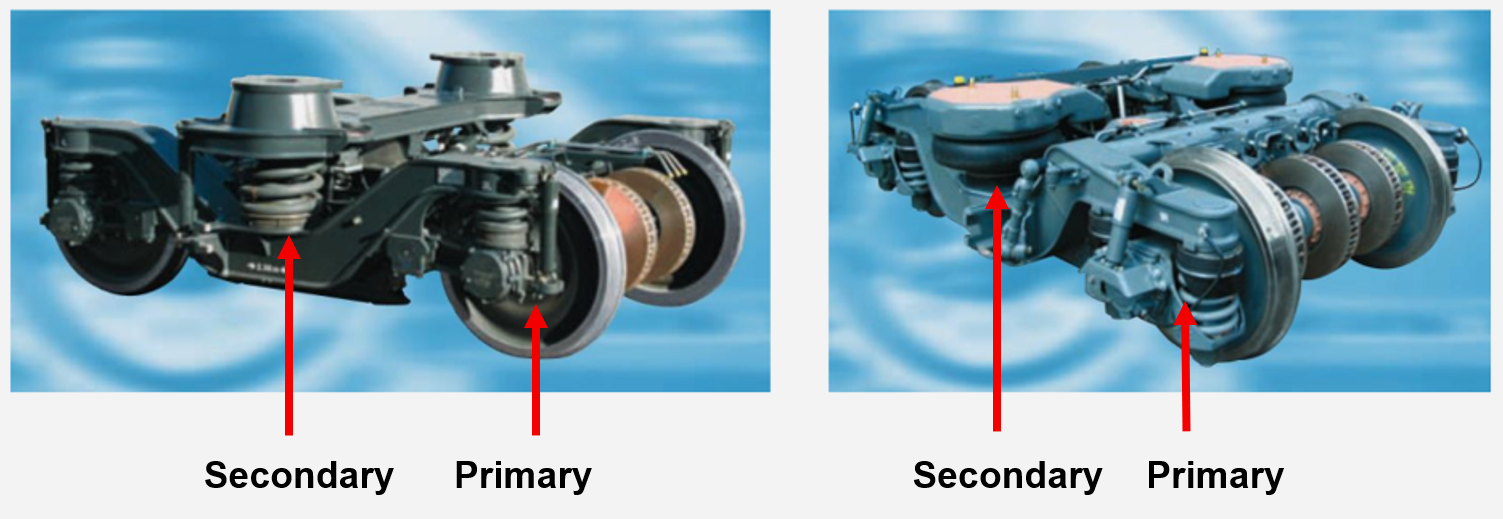
The typical transit vehicle consists of two fundamental ride controls: the primary and the secondary suspension systems. The primary suspension is located between the wheelset and truck frame. It is designed to attenuate higher-frequency vibrations and to facilitate steering behavior in curves. The secondary suspension is located between the truck and the car body. Its primary purpose is to mitigate lower-frequency vibrations transmitted into the car body and experienced by passengers. Figure 1 shows examples of transit vehicle trucks with the primary and secondary suspension systems labeled.
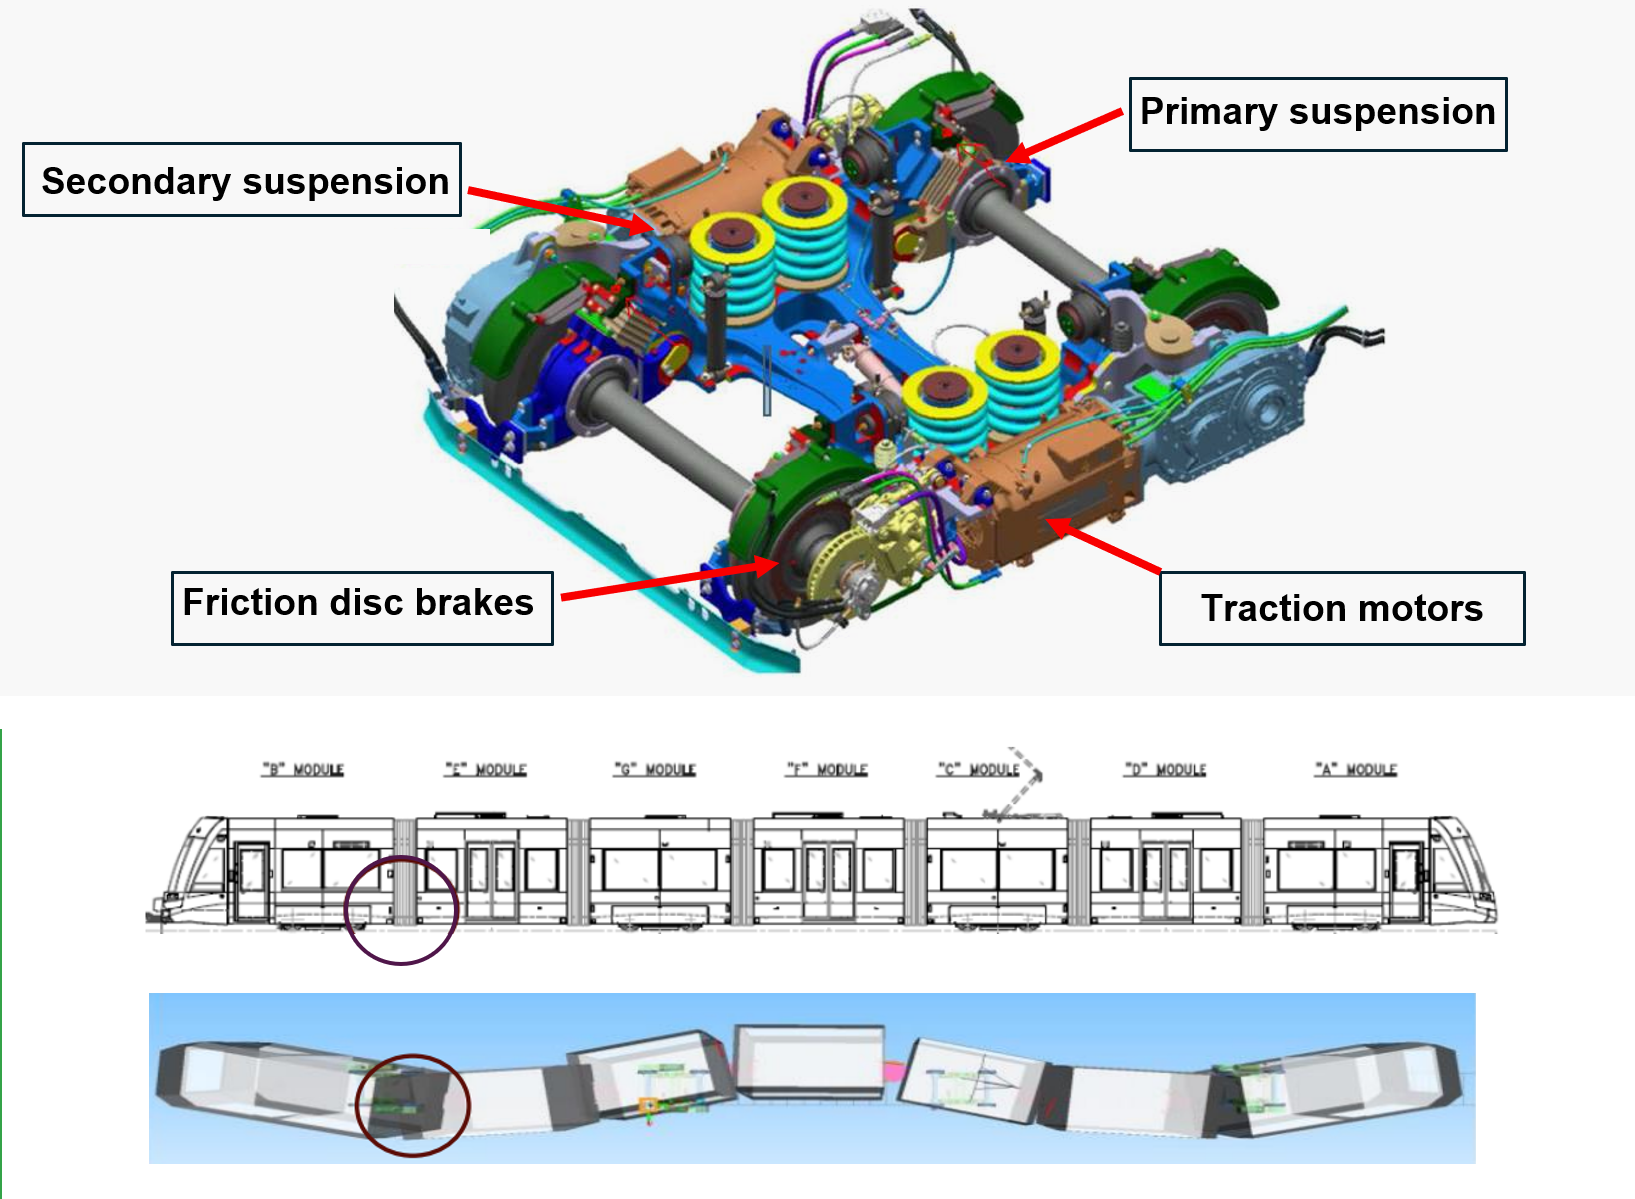
Figure 2 (top) shows an example truck from a low-floor LRV. The relative complexity of this truck is due to the unique challenges posed by low-floor vehicles. These vehicles tend to have their trucks separated by articulation points (see Figure 2 [bottom]). The layout requires additional fine-tuning to ensure stability in curves and at top speed, Skoblenick said.
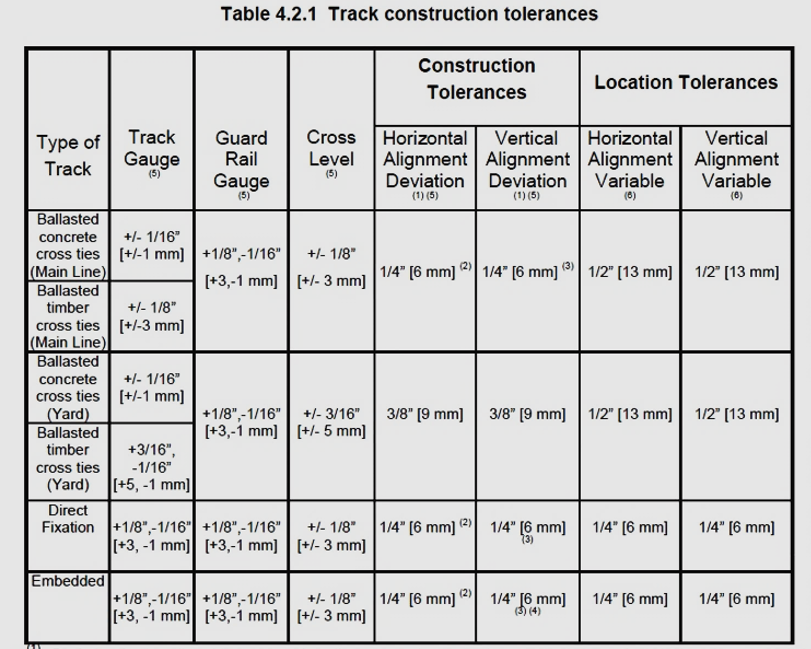
The truck, of course, only responds to the rail and track structure (and propulsion). Figure 3 shows construction tolerances for track geometry per the Transit Cooperative Research Program (TCRP) for North American transit systems. These are static figures, corresponding to a measurement at a single location. They’re critically important. But equally important, and often overlooked, is the rate of change (ROC) in geometry, Skoblenick said. Here the TCRP / FTA rate of change (ROC) criterion states: Rate of change variations in gage, horizontal alignment, vertical alignment, cross level, and track surface shall be limited to 0.125 inches [3 millimeters] per 15 feet [4.6 meters] of track. “Rate of change variations are really what lead to instability issues,” he said.
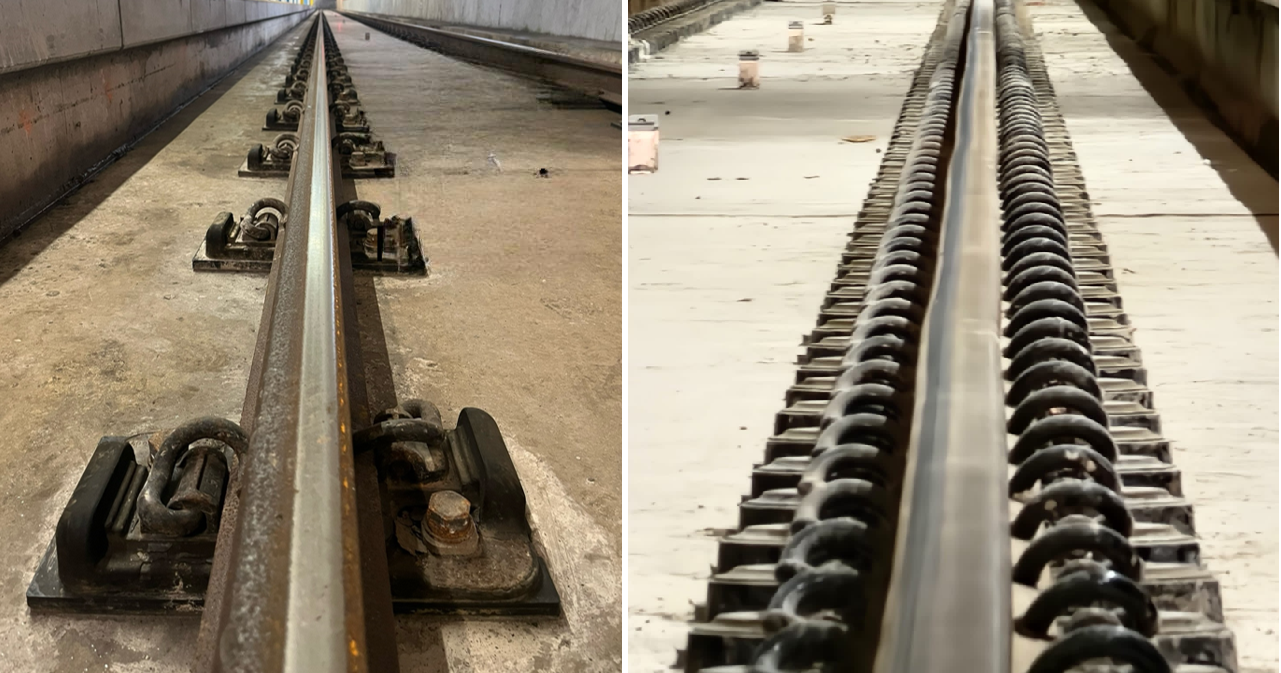
For example, Figure 4 (left) shows a rail that appears to be in good condition with regard to horizontal alignment when viewed in a 7-meter reference frame. Figure 4 (right) shows the same rail (telephoto image taken from the opposite direction) as viewed in a 38-meter reference frame—the horizontal alignment ROC is clearly visible. In this case, there is a track wave at 3 mm / 9 m (this is below the FTA ½ wave limit of 3 mm per 4.6 meters, which results in 3 mm / 9.2 m wave). “This kind of thing is very common to see in most North American track alignments,” Skoblenick said, “and it’s mostly due to tolerances in rail manufacture.” Transit vehicles/systems with a flange-gage-face-gap of <5 mm (most operate in the range of 6 mm to 8 mm) are particularly sensitive to such perturbations. At 35 kph (the operating speed for the example track section) vehicle trucks experience a harmonic cyclic horizontal input (i.e. vibration) at >1.1 Hz — a factor that will potentially detrimentally affect vehicle stability and ride quality within the carbody, above the secondary suspension.
Ride quality and stability concerns can be partially alleviated by adjusting the ROC criteria to more stringent thresholds, such as in the European standards, Skoblenick said. There, the equivalent (Class A) criterion for horizontal deviation is 3 mm per 9 m of track (which results in a wave at 3mm / 18m). A truck running through track at this ROC limit at 35 kph (as in the previous example) experiences vibration at >0.55 Hz. In other words, ride quality is improved even at the allowable limit, he said.
ROC criteria highlight the importance of specifying the proper classification of rail for the application. Class A 115RE rail has a 3 mm / 10 m horizontal ROC limit. Class B, which is the most common class in North American transit applications, has a horizontal ROC limit of 3 mm / 4.6 m (the same as the TCRP limit), Skoblenick said.
In evaluating ride quality, the maximum lateral acceleration considered “comfortable” is 0.7 m/s2. It’s also important to consider how long passengers experience accelerations; for example, an RMS acceleration limit of 0.35 m/s2 over 5 seconds is considered the limit for ride comfort, Skoblenick said.
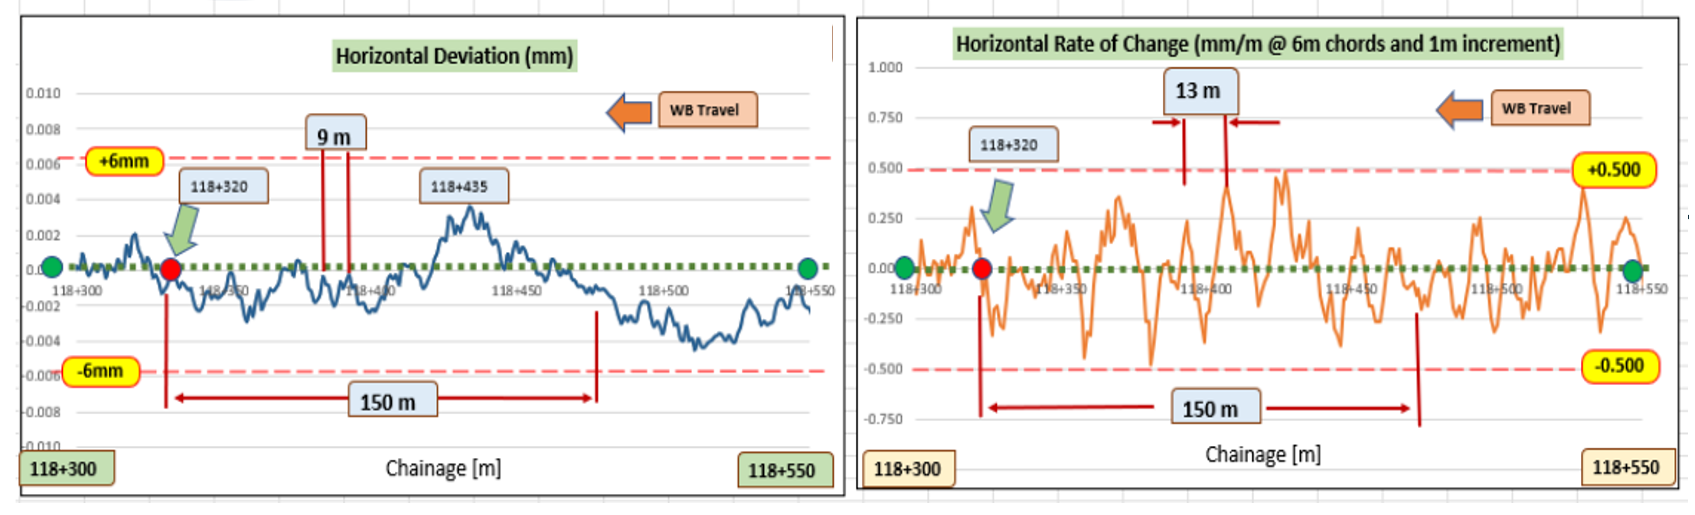
Skoblenick and Alstom have performed numerous ride quality analyses whose aim is to identify the root causes of potential or extant ride quality issues based on track geometry data. “This is survey data that can be collected even before you begin revenue testing on a new system,” Skoblenick said. Figure 5 shows horizontal alignment and horizontal ROC measurements from one such analysis. High amplitude harmonic waveforms over relatively short distances (such as the section marked “9 m” on the left graph) are indicative of “back-and-forth” alignment issues, and are likely to cause passenger discomfort. These patterns are even more apparent in the ROC in horizontal alignment (right graph). “This pattern shows a track that definitely needs to be straightened to get ride quality under control,” he said.
Wheel and Rail Profile
Factors beyond track geometry also affect vehicle/track interaction. Wheel and rail profiles are at the heart of wheel/rail interaction, and they have to be carefully managed in order to reduce wear at the interface and thereby optimize track stability and ride quality. Implementing and maintaining optimal wheel and rail profiles is a challenge in itself. “Once you start measuring, you’ll quickly find that the nominal rail profile is often not what’s actually out there,” Skoblenick said. This is even true of new rail.
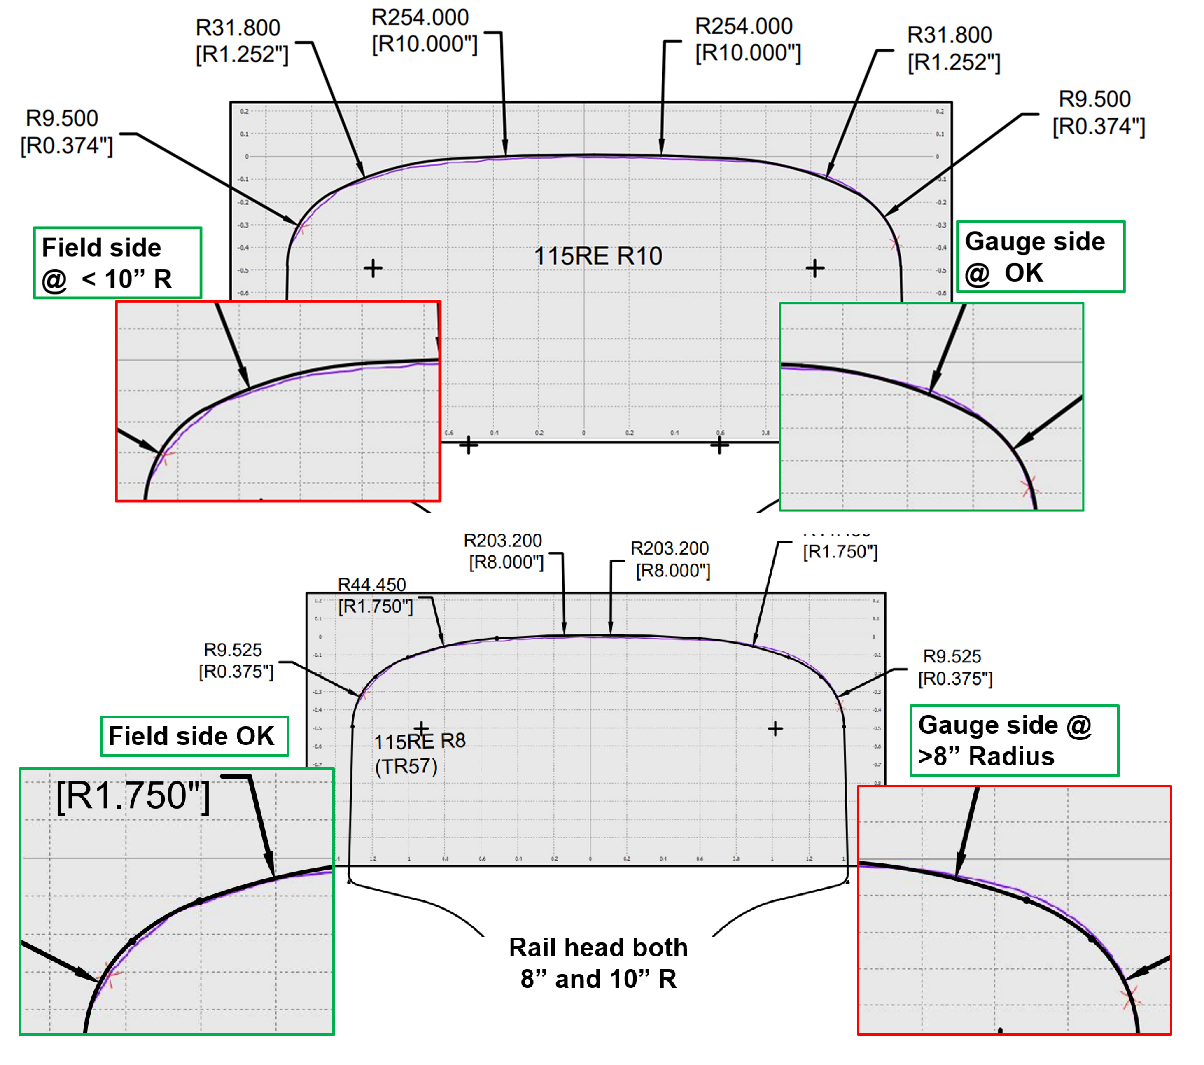
Figure 6 shows an example of newly-manufactured 115RE rail that was specified to a 10-inch radius profile. The top image shows a rail measured with a miniprof, overlayed with a 10-in AutoCAD profile template—note that the gage side of the rail fits the template, but the field side does not. The lower image shows the same rail overlayed with an 8-inch radius AutoCAD profile—note that the field side fits but the gage side does not. In other words, the rail is either a 10-in or 8-in profile depending on how it’s oriented, Skoblenick said. “This rail is still within TCRP and manufacturing tolerances, so it’s something the customer, the transit system, has to be aware of and measure for themselves.”
Many transit systems opt to apply their own custom wheel and/or rail profiles that are designed to benefit track stability and ride quality, and to mitigate wear and cumulative damage on the rail and wheels. From a stability and ride-quality standpoint, wheel and rail profiles affect the horizontal stability of the vehicle in tangent track and in curves by influencing the difference in rolling radius between the wheels of each wheelset, Skoblenick said.
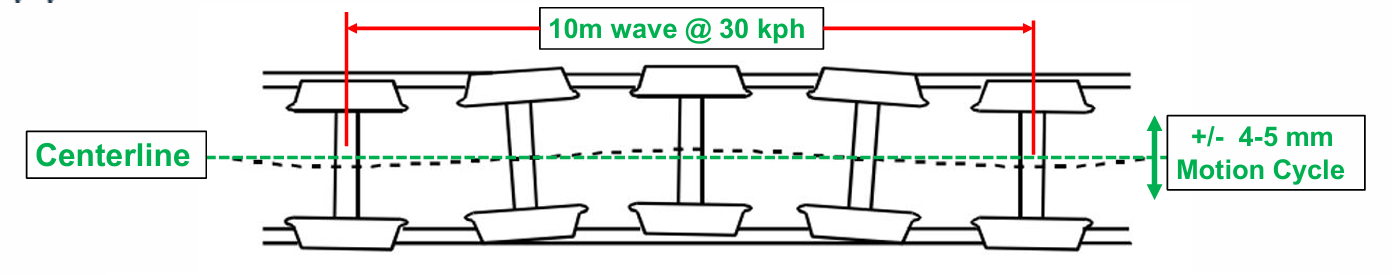
Consider a vehicle running through a tangent section of track. Counterintuitively, it does not move in a straight line down the track. Nor should it. To do so would be undesirable, leading to hollow worn wheels, conformal contact, and flattened rail profiles, Skoblenick said. Instead, the rolling radius difference (ΔR) of each wheelset induces a horizontal oscillating motion (see Figure 7) as one wheel’s radius increases and the other’s decreases until the difference is such that the wheelset is steered back the other direction. “Ideally, the oscillation cycle (i.e. the lateral offset) is in the ± 2 mm to 4 mm range. The wavelength [of the oscillation] is dependent on the effective conicity of the wheelset, wheel radius, track gage, and speed—at 30 kph, for example, a 10-meter wave is typical,” he said.
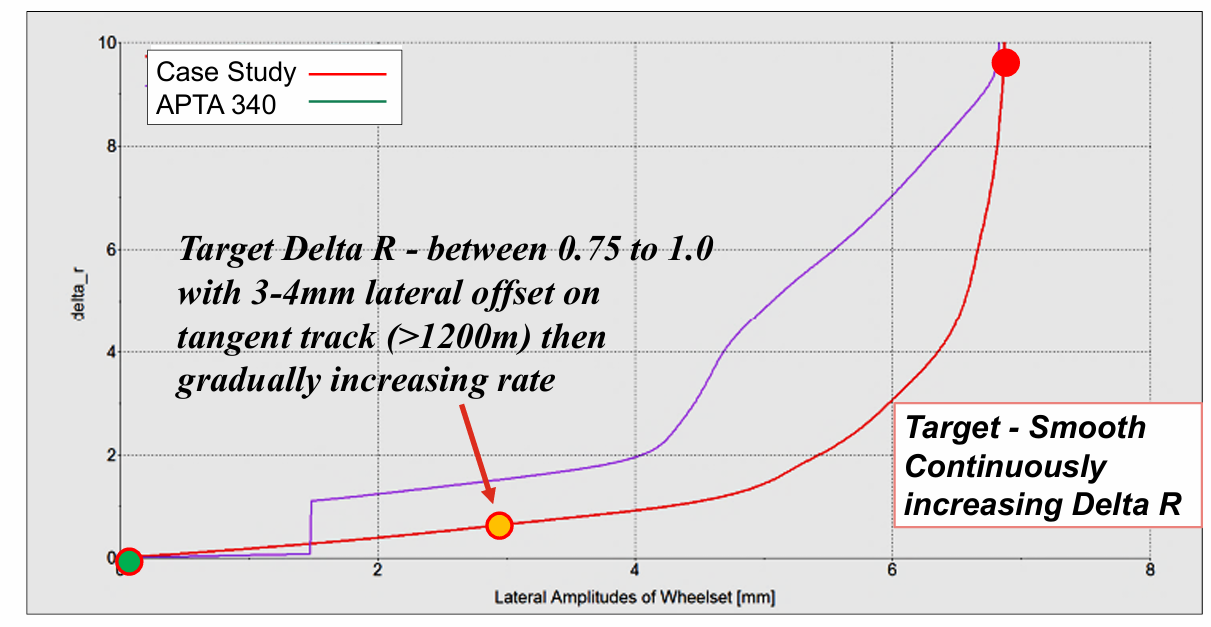
However, the wheelset kinematic motion must be carefully balanced. If the rolling radius difference and steering force is too high or too low, the wheelset will overshoot the ideal oscillation cycle and shift too far laterally. This causes an over-correction in the opposite direction, and so on, cyclically. This behavior—hunting—causes sinusoidal rail wear and typically leads to the development of rail corrugation, Skoblenick said. Single-point wheel/rail contact with an effective conicity between 0.1 and 0.2 is ideal for stability in tangent track. This can also be expressed as a target ΔR between 0.75 mm – 1.00 mm when the wheelset is laterally offset by 3 mm – 4 mm (see Figure 8).
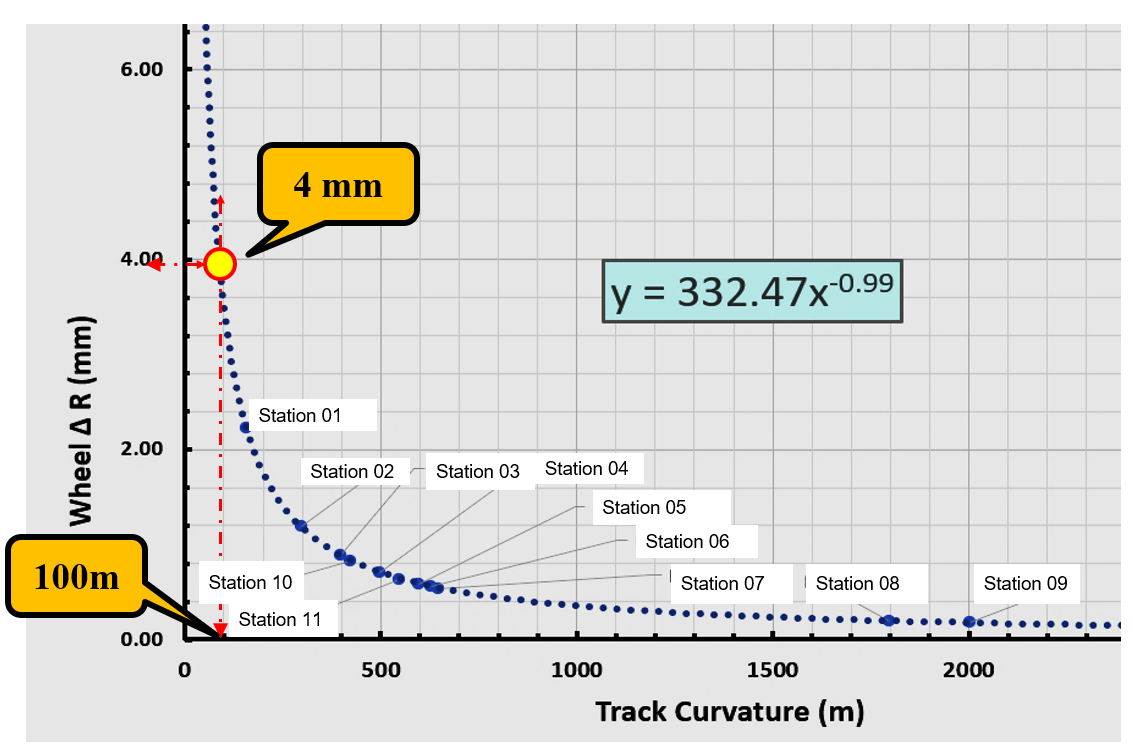
When it comes to steering through curves, it’s possible to chart the optimal rolling radius difference (ΔR) necessary to navigate a given curve without flanging (see Figure 9 for an example). An analysis like this can help zero in on the optimal wheel/rail profiles for a given property. Whether a network is predominantly made up of mild curves, or predominantly sharp curves also determines the ideal flange radius, together with the effective conicity for the wheel profile. Higher conicity profiles perform well in sharp curves, for example, but are more prone to hunting in tangent track.
The geometry of wheel-flange/gage-face contact—the contact angle—is another critical parameter. This value is used to calculate wheel climb risk in relation to lateral and vertical forces at the contact patch as described by the Nadal formula. (See The How and Why of L/V-based Thresholds – Interface Journal for more information on wheel climb risk and the Nadal formula.)
The optimization of vehicle stability and ride quality occupies a complex intersection of parameters, variables, and disciplines. Vehicle stability is a goal in itself, and it’s an indicator of nominal systemic conditions. It is also an apt display of the practical application of wheel/rail interaction principles.

Jeff Tuzik is Managing Editor of Interface Journal
This article is based on a presentation made at the 2025 Wheel/Rail Interaction Rail Transit conference.
Images are courtesy of Alstom and Transport Canada except where otherwise noted.