
Wheel Failure Modes: Concerning Trends in the Heavy Haul Industry
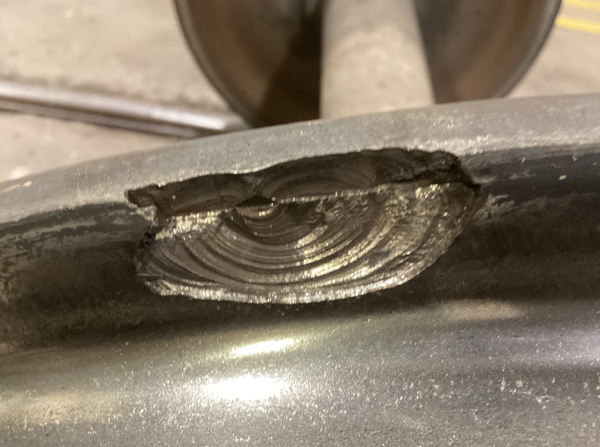
What causes a wheel to fail?
by Jeff Tuzik
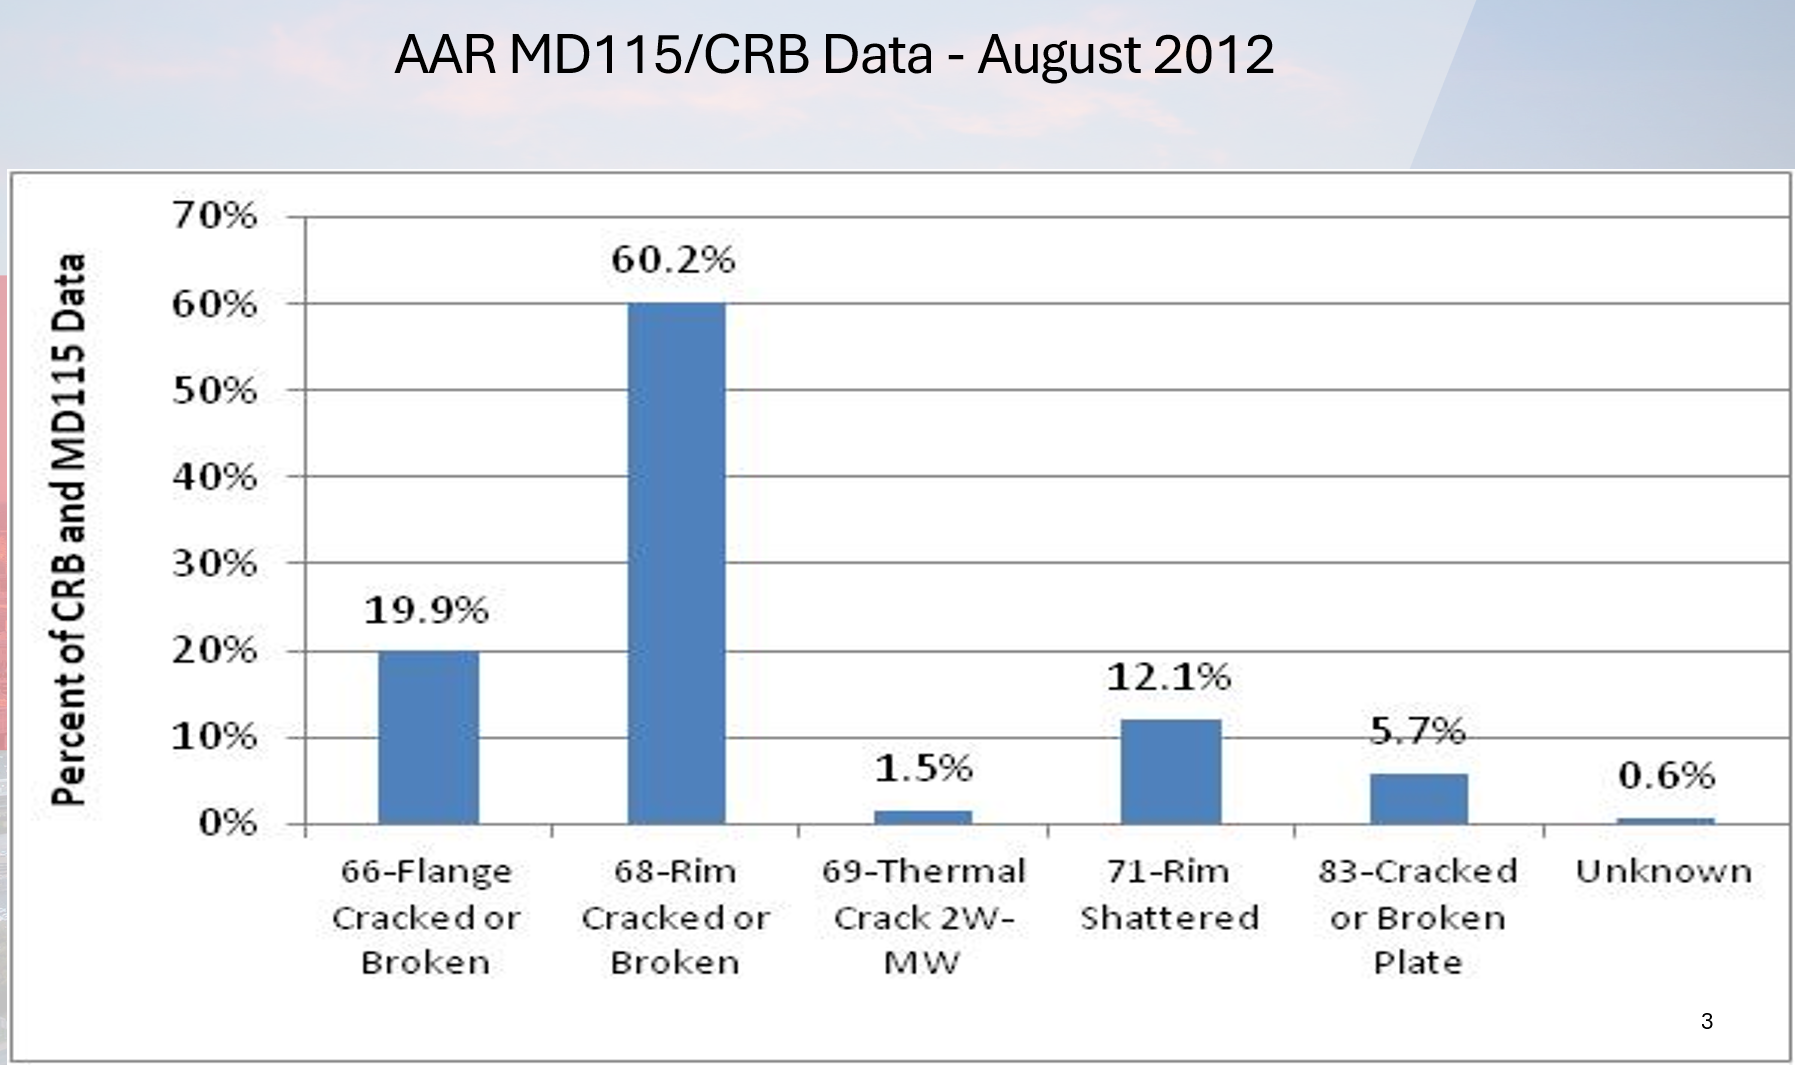
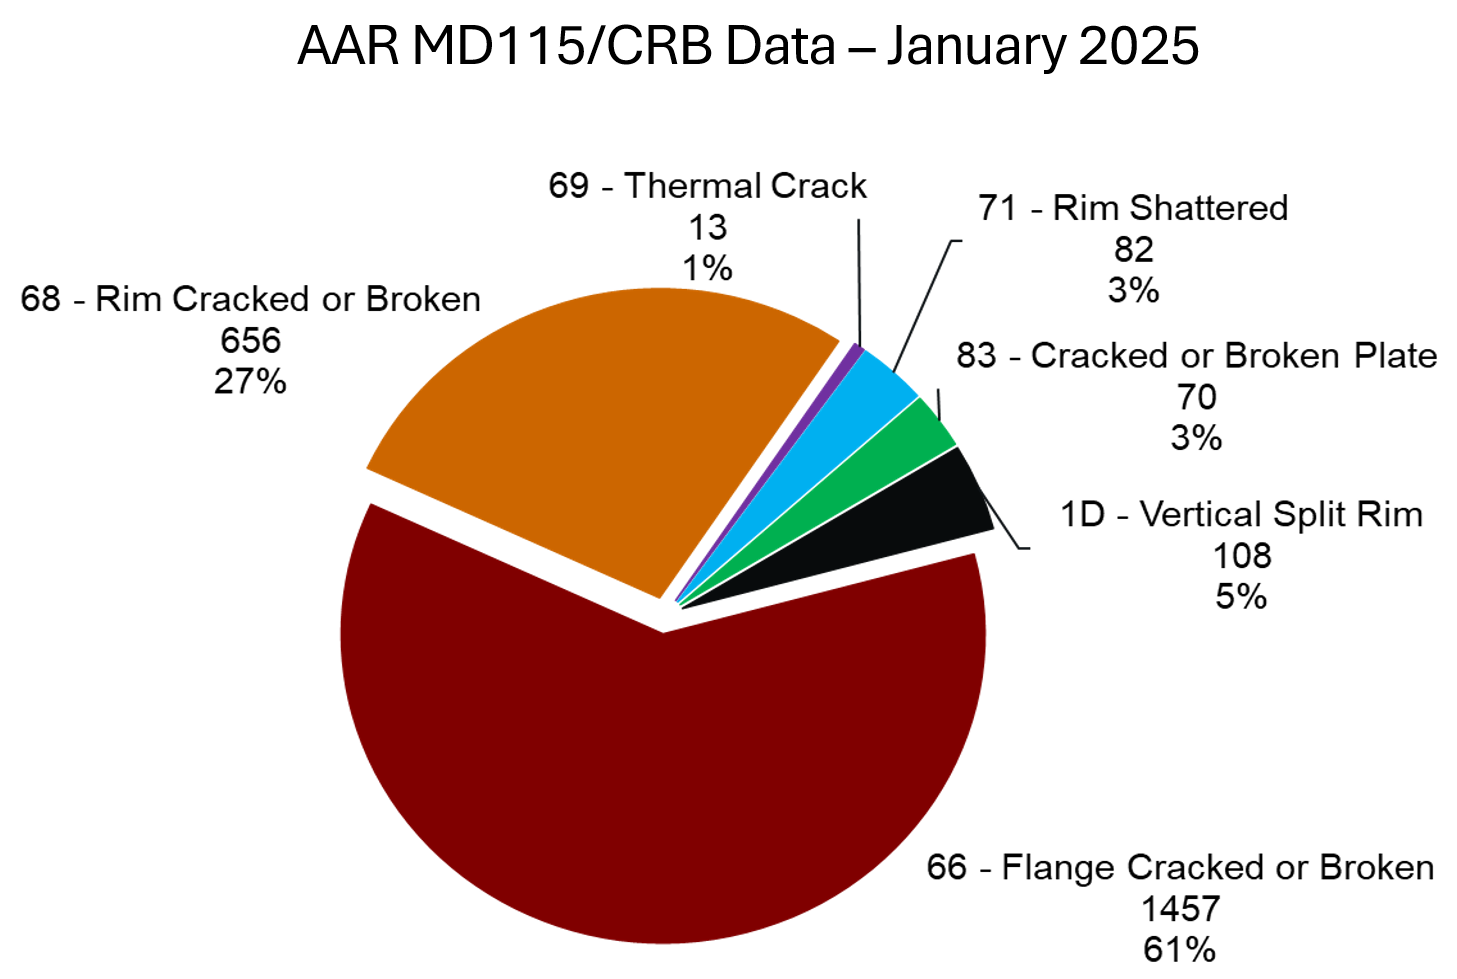
Statistically speaking, any wheel failure is an uncommon occurrence. But when it happens, the AAR hears about it. The specific cause of failure is categorized by Why Made (WM) codes and catalogued in AAR car repair billing (CRB) data, and in AAR mechanical defect (MD115) reporting. When all wheel failures are separated by failure mode (i.e., WM code) it’s easy to see which defect types are causing the bulk of the failures, and thus which are the most important (and economic) to target, research, and mitigate. Over time, trends have appeared in the data, and trends have shifted (see figure 1).
Cracked or broken flanges (WM 66) have become an area of particular concern over the past decade-plus. “Back in 2012, Why Made 66—flange cracked or broken—was only 19.9-percent of the total wheel failures. By 2015, Why Made 66 was up to [roughly] 31-percent of the total,” Cameron Lonsdale, Vice President – Industry Relations at Amsted Rail, told colleagues at the 2026 WRI Heavy Haul Conference.
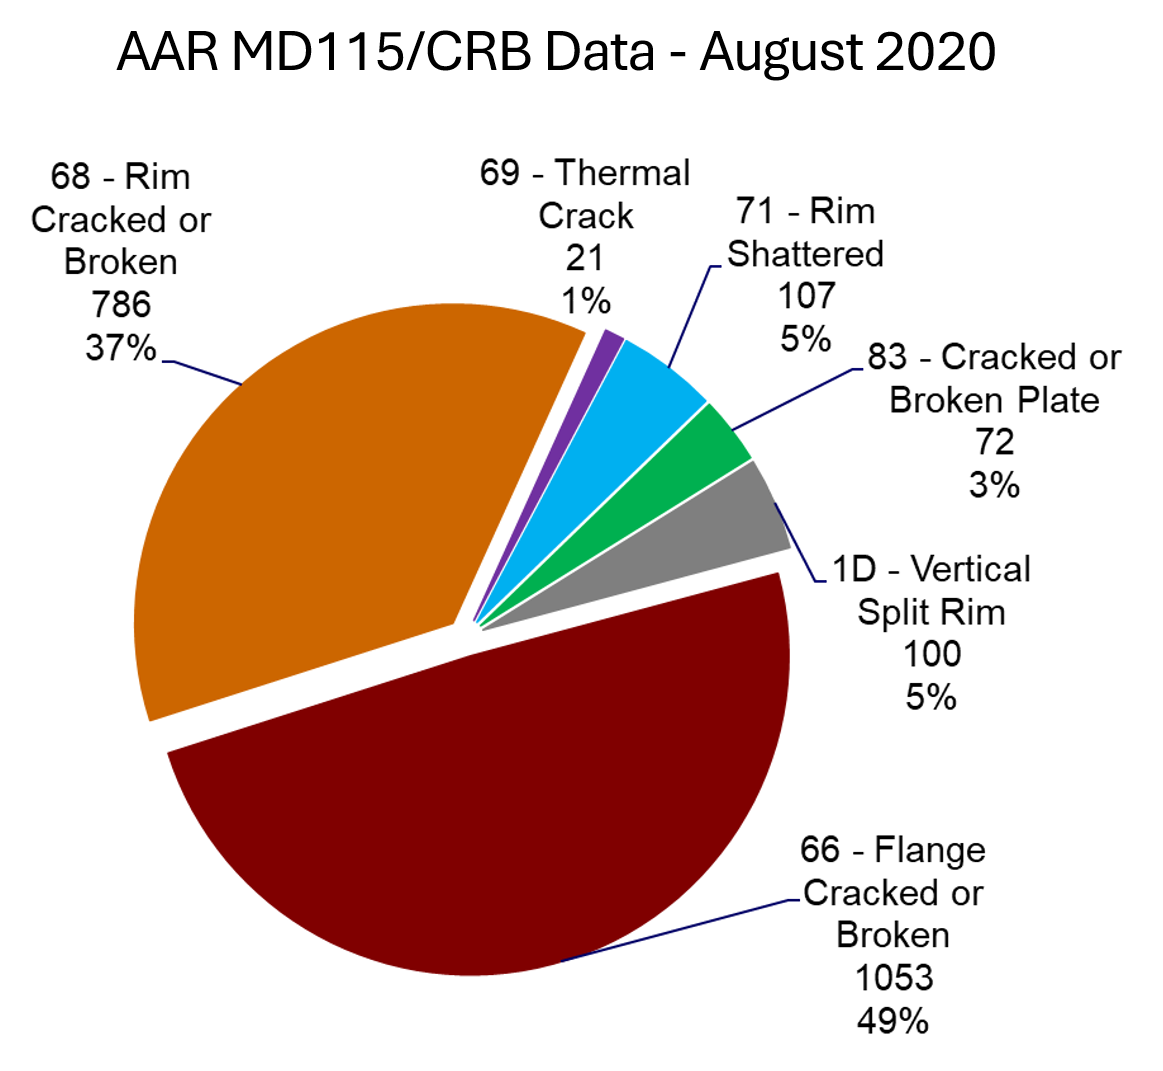
From 2015 to the end of 2017, WM 66 accounted for 36.6% of all wheel failures. During the same period, other WM codes decreased, both as a percentage of the whole, and in number of failures. Shattered rims (WM 71), for example, fell from 11% (181 failures) in the three-year period ending in late 2015 to 8% (114 failures) in the three-year period ending in late 2017. “Cracked or broken rims [WM 68] was still the biggest piece of the pie, but flanges were creeping up quickly,” Lonsdale said. And by the end of 2020, cracked/broken flanges had overtaken cracked/broken rims as the leading WM code, at 49.2% and 36.7% respectively (see Figure 2). Again, during this period, shattered rims (WM 71) and cracked/broken plate (WM 83) decreased in percentage and number. “Tightened thresholds for testing, cleaner steel, and adding a riser in 36-inch cast-wheels all helped bring the numbers down.”
Cracked or broken flanges accounted for 61% of wheel failure modes in the roughly three-year period leading into 2025 (the most recent full data set at the time of this presentation). All other WM codes are dwarfed by comparison (see Figure 3. Note that this data also includes WM 1D – vertical split rim failures).
The rapid increase in cracked/broken flanges (WM 66) between 2012 and today rang alarm bells in the industry. In the ≈3-years-pre-2012 data, 535 cracked/broken flanges were reported to the AAR. In the 2025 data covering roughly the same span of time, there were 1457, nearly triple the number. In the same period, cracked and broken rims (WM 68) fell dramatically as a percentage of failure modes (from 60% to 32%) but less dramatically in terms of number of failures (886 to 764). Shattered rims (WM 71) fell from 12% to 3%, and cracked/broken plates decreased from 5.7% to 3%. “But we’ve seen some newer failure modes where impacts, including impacts on the back of a plate, have caused a fracture of the front side,” Lonsdale said.
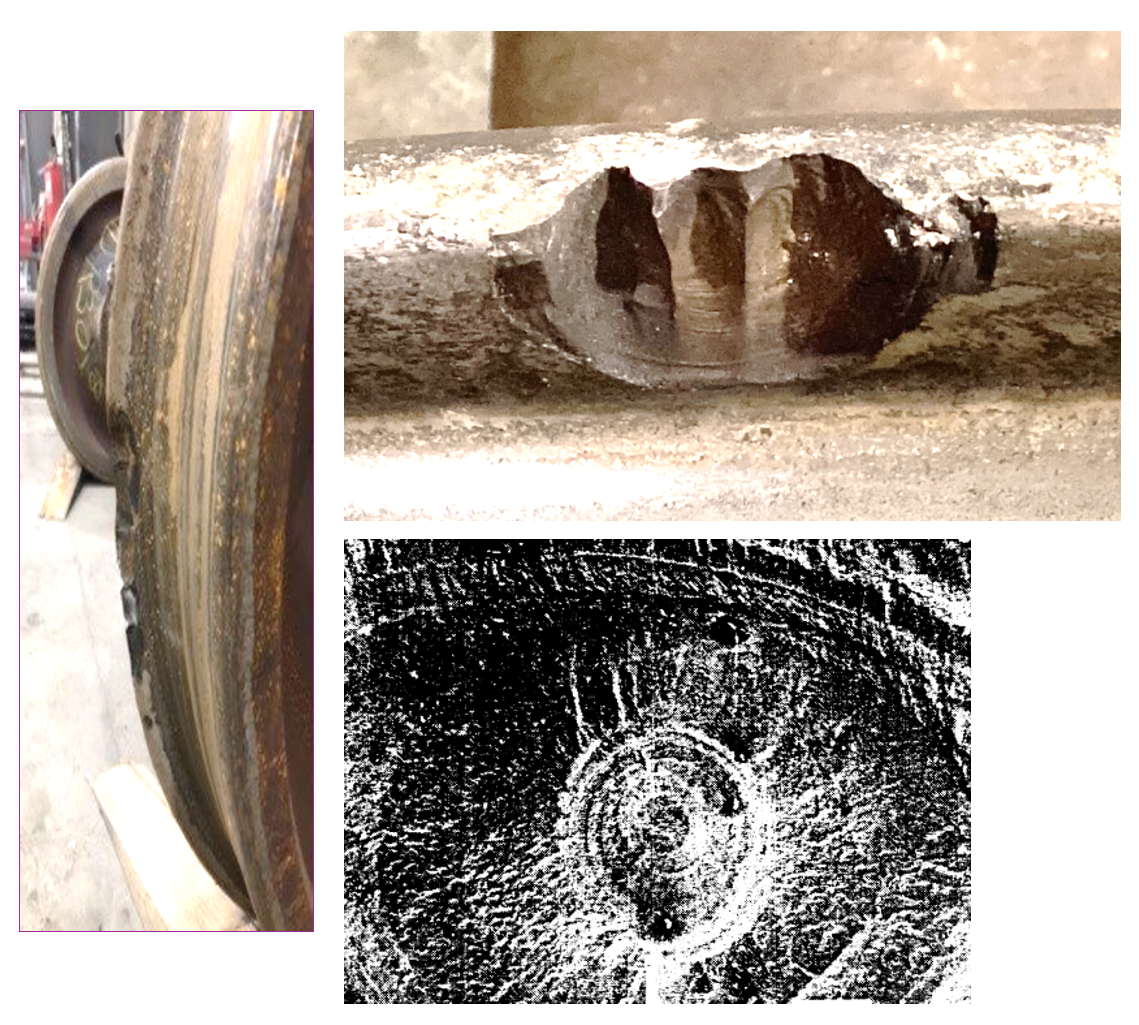
There are at least two distinct mechanisms that are reported with the same WM code (66), Lonsdale said. “But it’s important to separate these out so we can determine what the root cause really is.” Shelling on the wheel flange face due to rolling contact fatigue (RCF) is one primary mechanism. Wheel flange apex-initiated cracking is another—one that may be a new North American service phenomenon, he said.
Figure 4 shows examples of wheel flange shelling. “TTCI (now MxV Rail) discovered these defects when they turned off the lubricators on their FAST test track,” Lonsdale said. Two-point contact resulting in high forces at the wheel flange face are a major contributor to the failure mode.
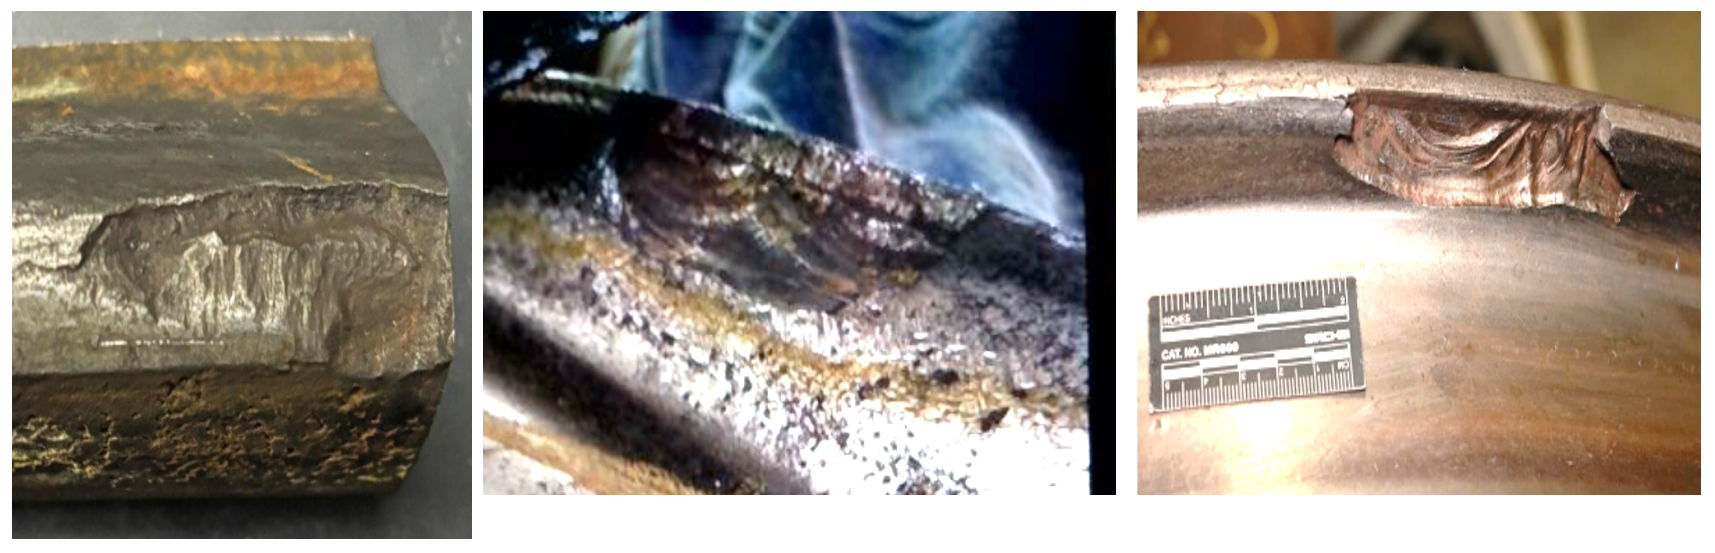
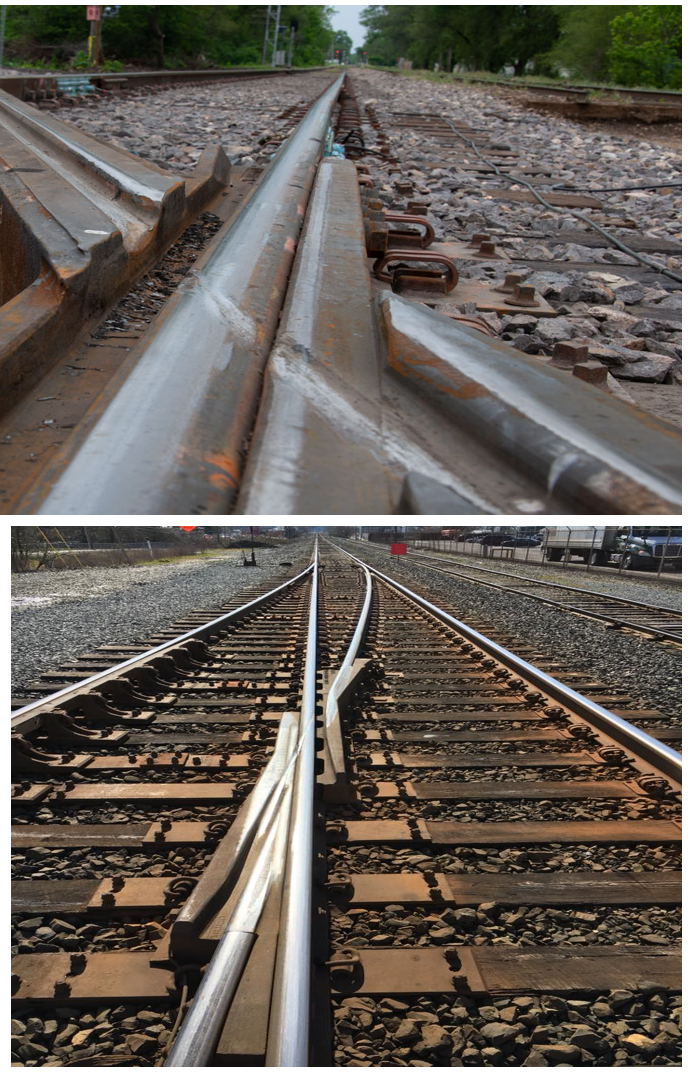
Figure 5 shows examples of flange apex-initiated cracking. This failure mode is characterized by fatigue cracking initiated at the apex of the flange and is thought to be associated with flange-bearing frogs and diamonds, Lonsdale said (see Figure 6, which shows examples of flange-bearing trackwork with flange marks clearly visible). The FRA waiver allowing for the use of flange-bearing trackwork went into effect in 2010. The justification for flange-bearing frogs and crossings is a reduction in frog repairs and changeouts because the wheel tread doesn’t impact the frog point. “There’s no question that these crossings save the maintenance-of-way department millions of dollars, however, the flange apex is not designed to support the nominal 35,750-lb wheel load associated with a 286,000-lb GRL car.” Additionally, the new AAR 2A profile has a narrower flange than the older AAR 1 BWF wheel, which further concentrates stress at the tip or apex of the flange.
Initial finite element analysis of the AAR 1BWF and AAR 2A wheels indicate that under a 35,750 lb load at the flange apex, the older AAR 1BWF has a maximum subsurface shear stress of 585 MPa or 99.35 ksi. Under the same conditions, the AAR 2A has a maximum subsurface shear stress of 707 MPa or 102.5 ksi. “This is just an elementary analysis, and we’re going to have to do a lot of research on this, but it’s clear that the thinner flange is a potential contributor,” Lonsdale said.
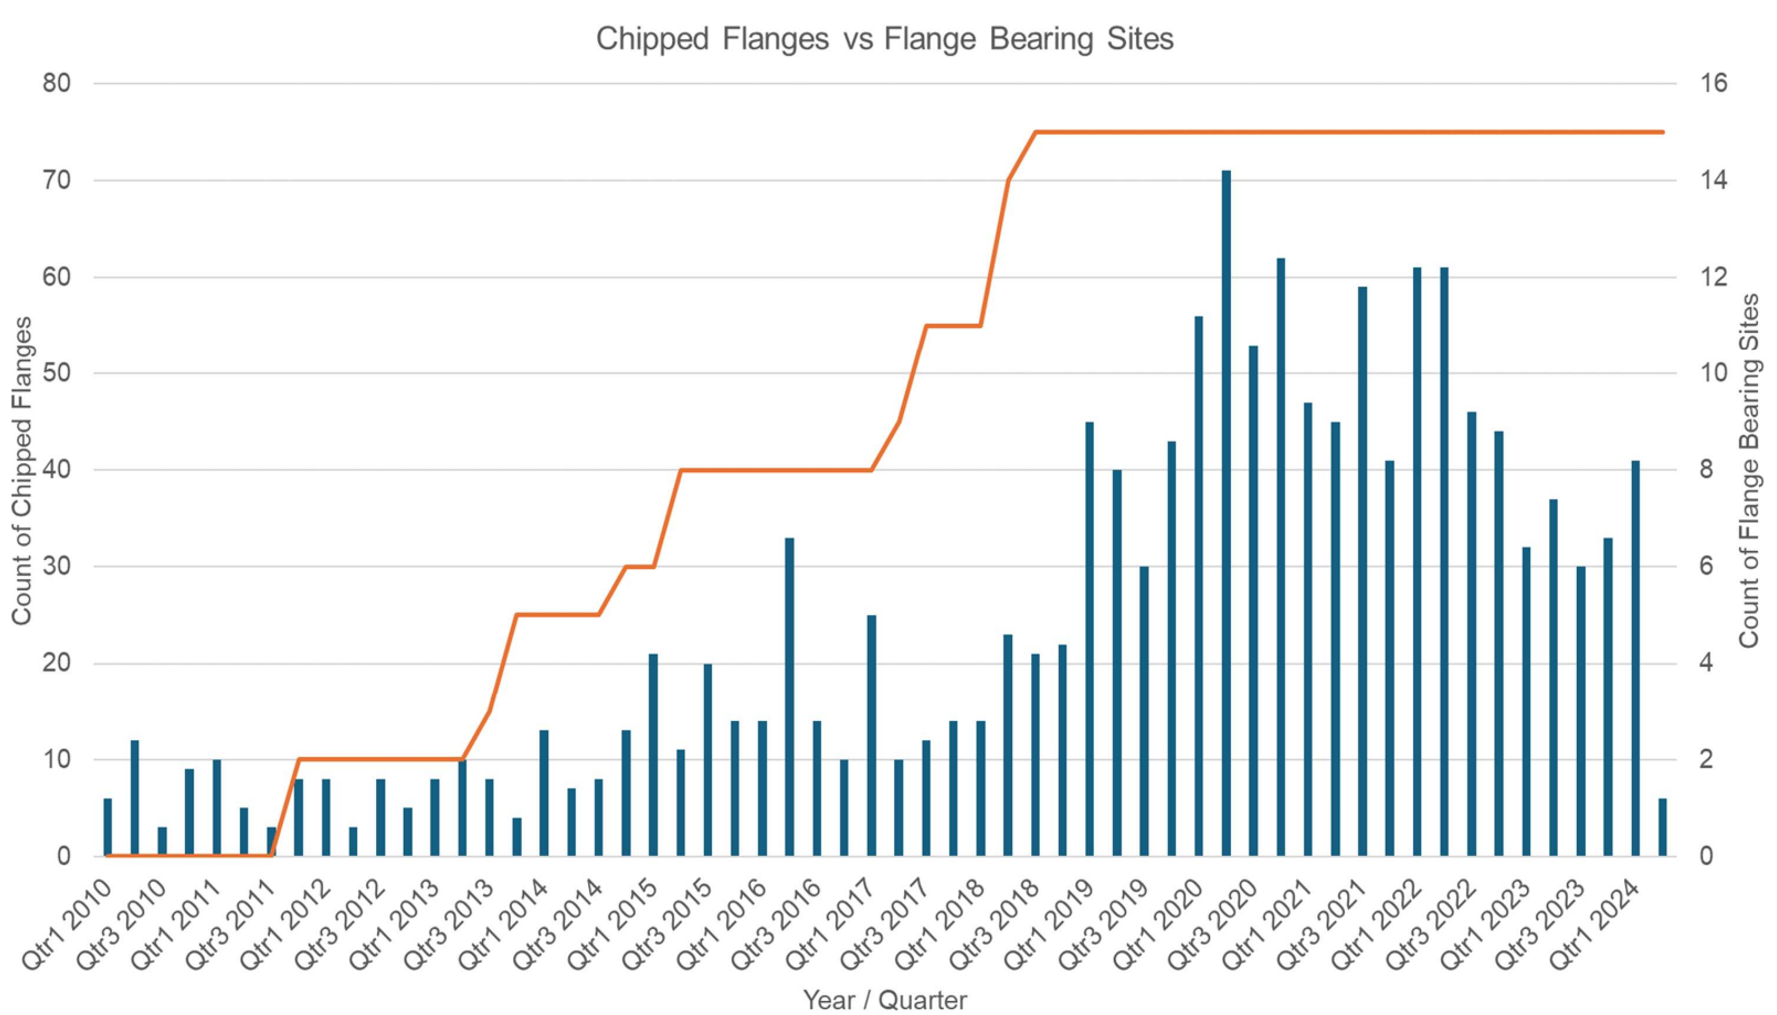
Anonymized data from a class 1 railroad supports the hypothesis. The data (see Figure 7) shows the total number of chipped flanges per quarter as well as the count of flange-bearing trackwork sites. The trend clearly shows a steadily increasing number of chipped flanges as the number of flange-bearing sites increases, beginning with the FRA waiver in 2010, Lonsdale said.
An Emerging Defect Type
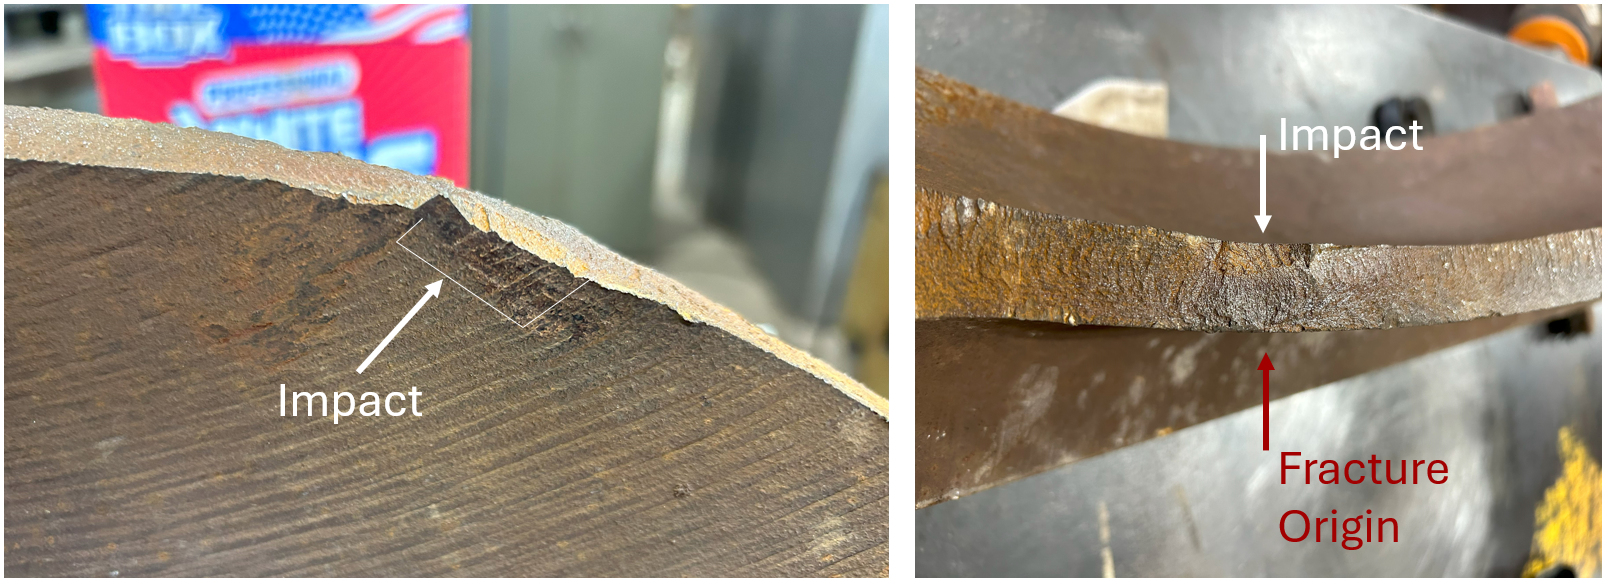
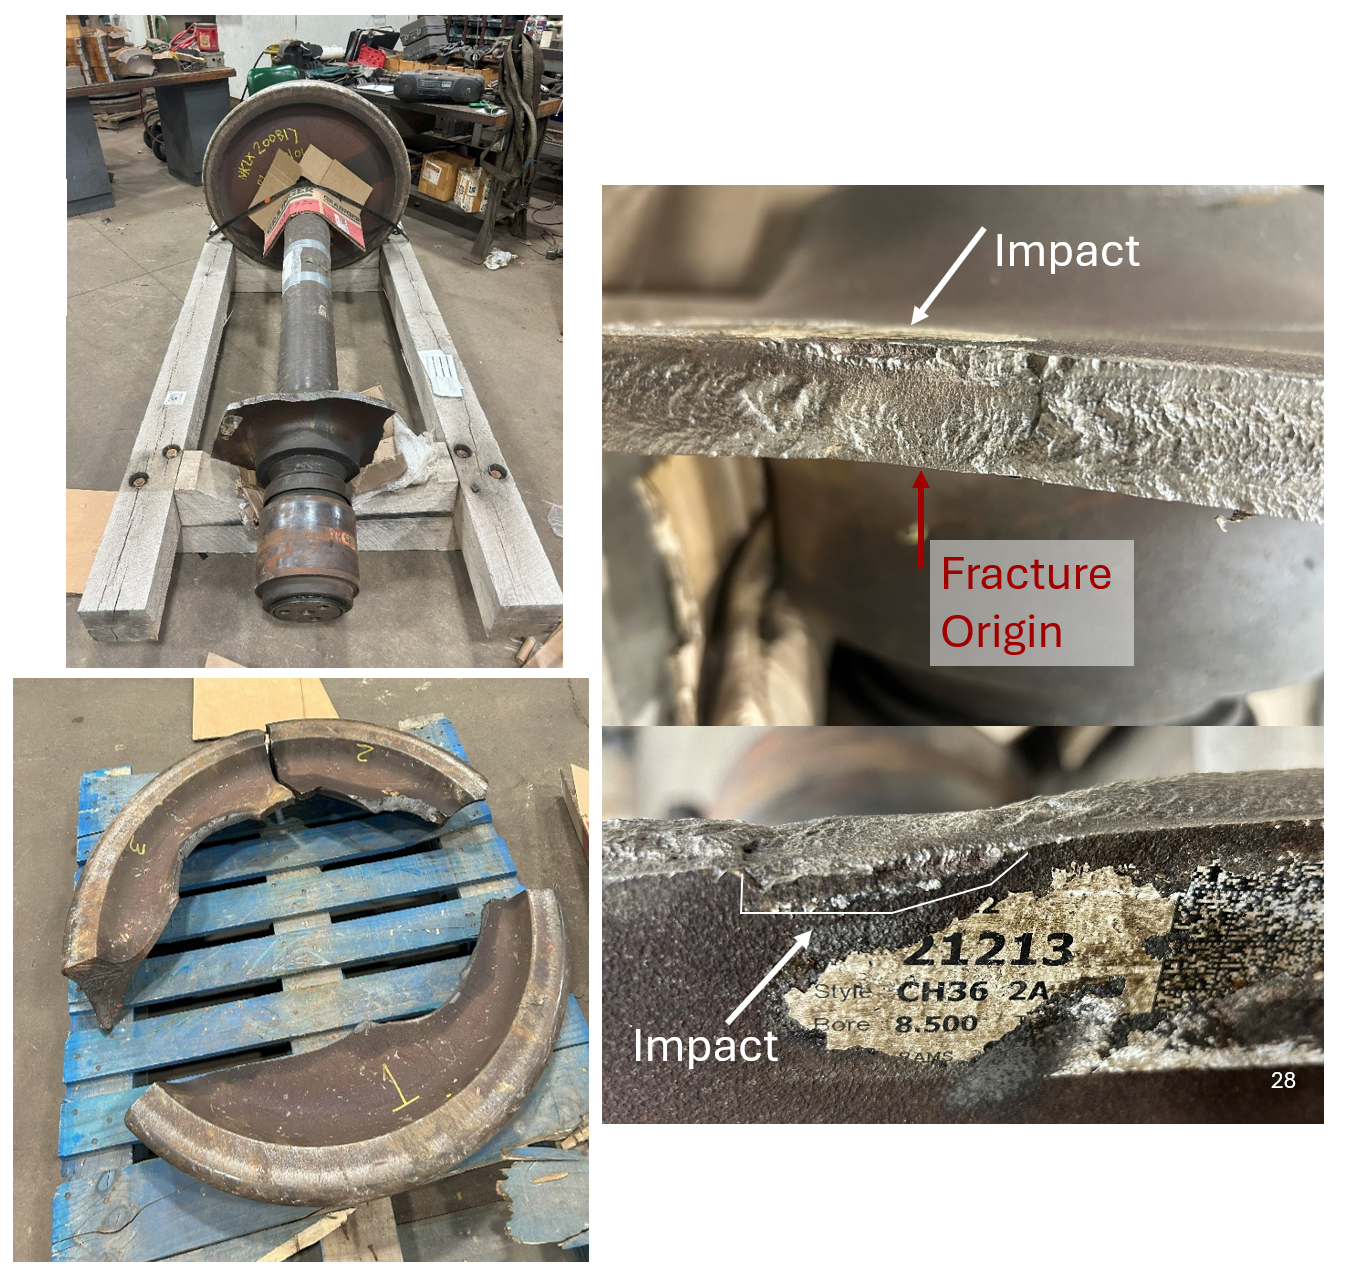
While cracked or broken flanges remain the issue of greatest concern when it comes to wheel failures, a type of wheel plate failure mode has begun to appear on North American class 1s, and while comparatively quite rare, it is nonetheless cause for concern. The defect is characterized by impact damage to the back of the wheel plate leading to a fracture that initiates on the front of the plate (categorized as WM 83, cracked or broken plate). Figure 8 shows an example of back-of-plate impact damage (left) and a subsequent fracture (right). “These impacts are very difficult to detect—it’s almost like something has pressed into the wheel rather than a traditional impact. But we’re certainly seeing more of them lately,” Lonsdale said. Figure 9 shows another example of a plate failure due to a back-of-the-plate impact. “When a plate fails, it’s always catastrophic. That train is going into the ditch,” he said. As is typical of this type of defect, the crack origin point is directly opposite the point of impact.
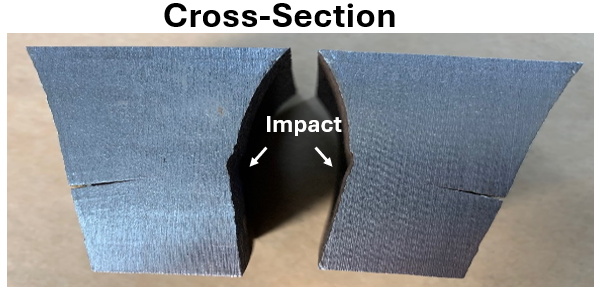
A cross section of an impacted plate (see Figure 10) clearly shows crack propagation on the front of the wheel plate as well as the deceptively minor impact on the read of the plate. Analysis of these types of plate failures has also ruled out metallurgical or production defects as the cause for the crack initiation and propagation, indicating that the impact is indeed the inciting event, Lonsdale said.
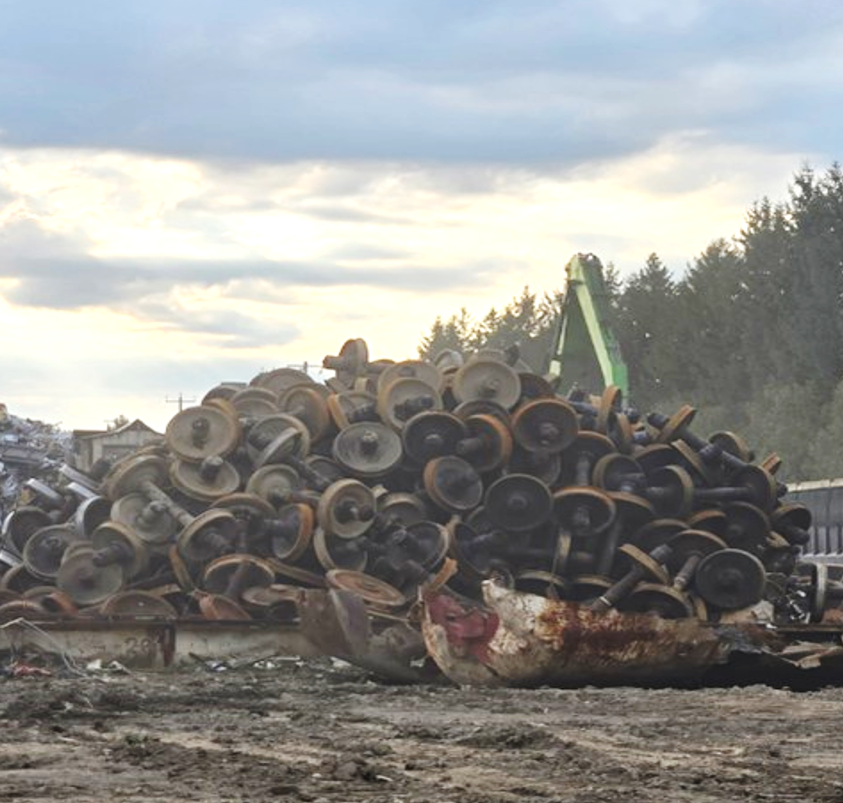
Amsted Rail has done extensive wheel plate impact (drop hammer) testing to try to determine the root cause of the failure mode. “We’re finding that relatively minor impacts have the potential to initiate plate cracking, but what we haven’t found is what’s causing these impacts out in service,” Lonsdale said. There are theories, however. Plate impacts may be the result of mishandling in shops and repair facilities, but there is another likely candidate. Figure 11, for example, shows a location where “purchased core” wheelsets (i.e., wheelsets removed from scrap cars). “This is a scary picture to anyone in the wheel business,” he said. The AAR WABL (wheels, axles, bearings and lubrication) committee is now exploring tightening inspection at scrapyard/purchased core facilities. “Anybody that buys purchased cores is going to have some nominal supervision, and series of rules put in place to make sure [images like Figure 11] are a thing of the past.”
Mitigating the rising prevalence of cracked or broken flanges (WM 66) is a clear priority for the AAR, suppliers, and the railroad industry as a whole. It’s a problem with no clear solution in sight, but with a lot of expertise on the case. Broken flange incidences continue to trend upward. Until the root cause is identified and widespread preventive measures are implemented, it’s an issue that the industry will continue to grapple with.

Jeff Tuzik is Managing Editor of Interface Journal
This article is based on a presentation made at the 2026 Wheel/Rail Interaction Heavy Haul Conference.
All images are courtesy of Cameron Lonsdale, and the AAR WABL committee except where otherwise noted.