
The Theory & The Praxis: An Introduction to Wheel/Rail Interaction. Part 2.
by Jeff Tuzik
Part 1 of this article looked at the track, vehicle, and the contact patch — some of the core principles and components of wheel/rail interaction that were covered at the 2026 WRI Heavy Haul Principles Course. Part 2 continues with an introduction to vehicle/track interaction, wheel and rail damage mechanisms, and vehicle and track measurement technologies, along with the conclusion of the derailment case study.
Vehicle/Track Interaction
The mechanics of wheel/rail interaction at the contact patch illuminate a critical part of the wheel/rail system. But they don’t necessarily capture the full picture. What happens at the contact patch affects and is affected by the greater vehicle and track system.
The conical shape of the wheel, specifically the rolling radius difference between wheels of a wheelset (as discussed in pt. 1), is instrumental in facilitating steering through curves. That same steering tendency can cause stability issues at high speeds, said Corey Pasta, Scientist in the Research & Innovation department at MxV Rail. Truck hunting occurs at higher speeds, typically on empty cars, as the result of a wheelset oscillating laterally as the conicity of the wheel essentially “steers” back and forth across the track (see Video 1).

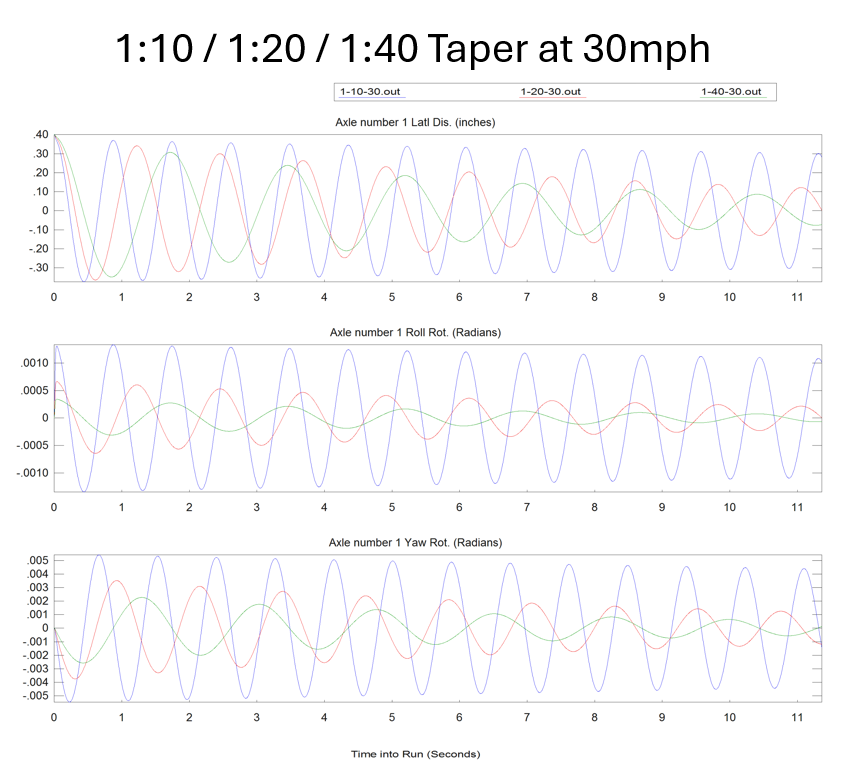
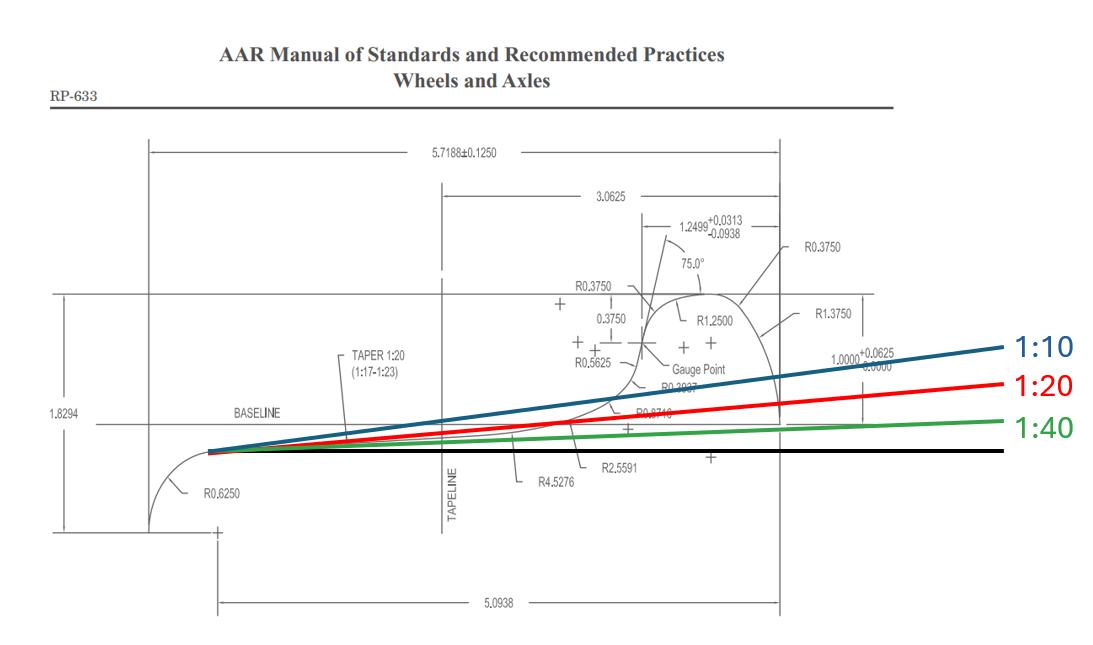
“On tangent track, you should be in the mildly tapered section of the wheel, not toward the flange where the radius increases rapidly,” he said. The standard AAR 2A wheel profile has a 1:20 taper on the tread to mitigate high speed hunting (see Figure 1). The wavelength of hunting oscillation is dictated by wheel conicity, wheel radius, and track gage. “Higher conicity means a shorter wavelength, or more frequent oscillation,” Pasta said. Figure 2 shows examples of wheelset oscillation at 30 mph for 1:10, 1:20, and 1:40 wheel tapers. Note that the flatter the taper, the longer the oscillation wavelength, or the lower the propensity for hunting.
Tight gage is particularly problematic with regard to hunting because equivalent conicity (and rolling radius difference) increases sharply and generates greater instability at the wheel flange root. Maintaining the proper track gage and rail profiles reduces the propensity for hunting. On the mechanical side, hunting can be mitigated by maintaining the proper wheel profiles and truck yaw, lateral, and warp stiffness (increasing stiffness increases high-speed stability), and wheelset mass and yaw inertia (which affects angle of attack and steering).
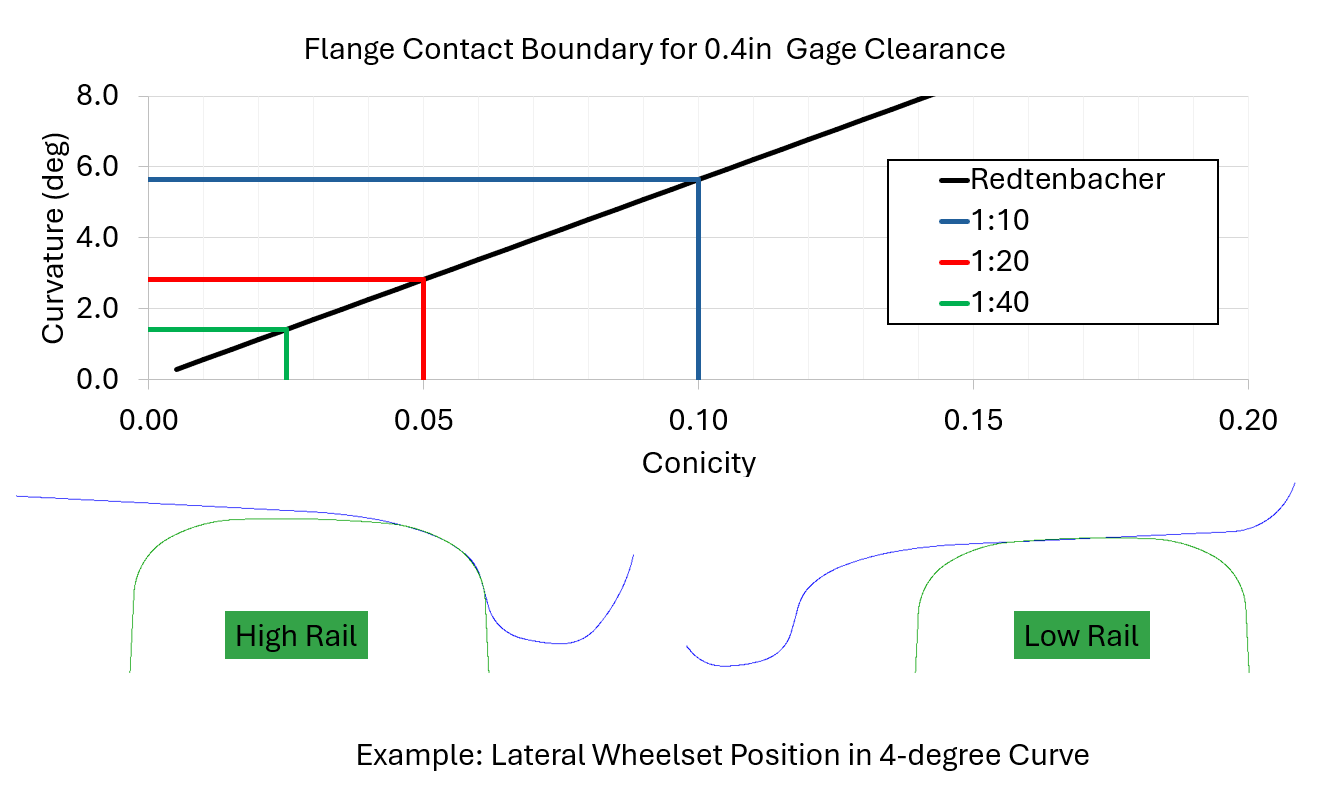
While low conicity is desirable to avoid hunting, high conicity is desirable for curving performance. There will always be a tradeoff, Pasta said. For example, a high-conicity/low-stability wheel with a 1:10 taper can navigate up to a 6-degree curve before making flange contact. A low-conicity/high-stability wheel with a 1:40 taper can only navigate a ≈1.8-degree curve before making flange contact (see Figure 3).
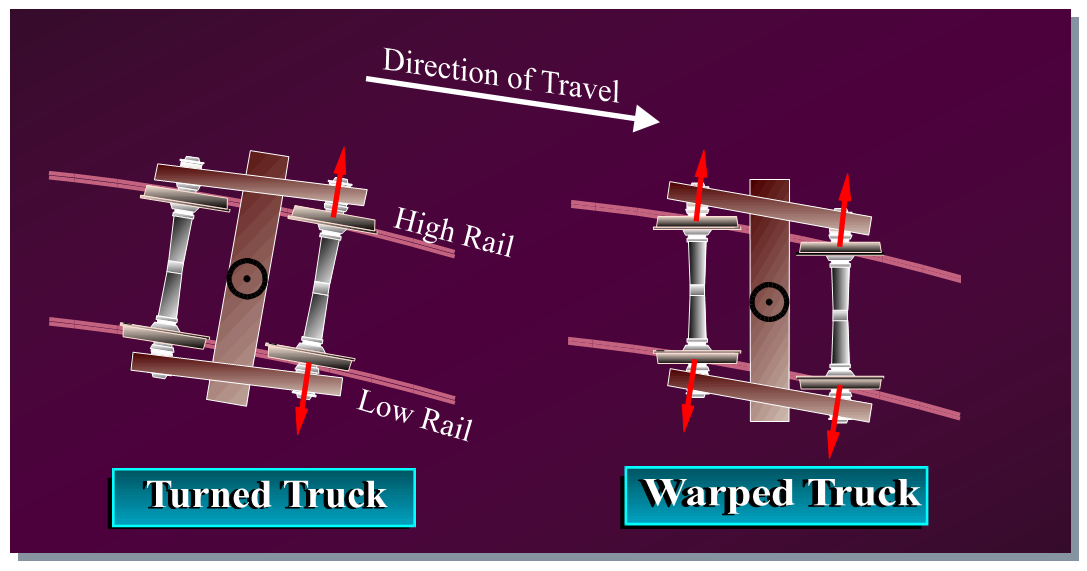
In addition to mitigating hunting, truck stiffness plays an important role in optimizing curving and steering. As a truck navigates a curve, the lead wheelset takes on an angle of attack where the lead wheel on the high rail side is displaced toward the high rail, which increases the rolling radius difference of the wheelset and facilitates steering. The trailing wheelset tends to be more centered. On a truck with poor warp stiffness, both the lead and the trailing wheelsets take an angle of attack (see Figure 4), which causes unnecessary additional wear and gage-spreading forces, Pasta said. “If you have multiple trucks [with low warp stiffness] in a row, you’re putting a lot of lateral stress on the localized track structure. The additional lateral stress has the potential to roll the rail.”
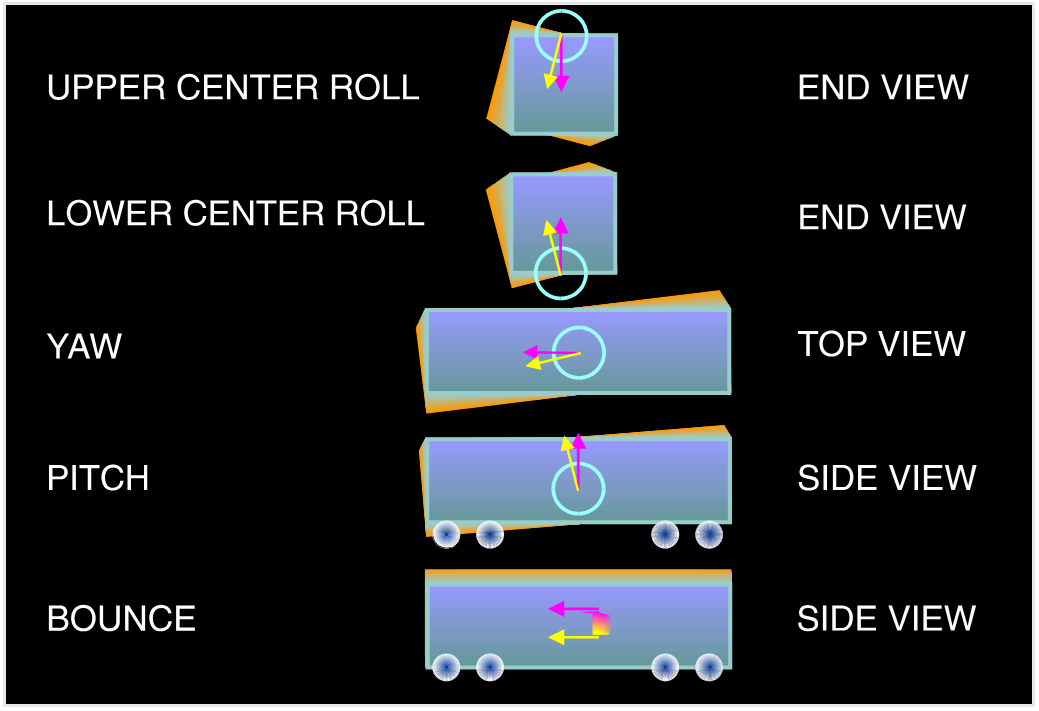
As mentioned in Part 1, every spring-mass-damper system, such as a rail car, has a resonance. If this resonance is excited by specific track characteristics at a certain speed, the car will respond, sometimes dramatically (see Video 2). It can take the form of roll, yaw, pitch, or bounce (see Figure 5). Each mode and each car type has its own critical speed or frequency, Pasta said. “Cars are designed to mitigate resonance, but they have to be well maintained, and they have to be on well-maintained track, otherwise you lose the benefit of all that engineering.”
Wheel/Rail Damage Mechanisms
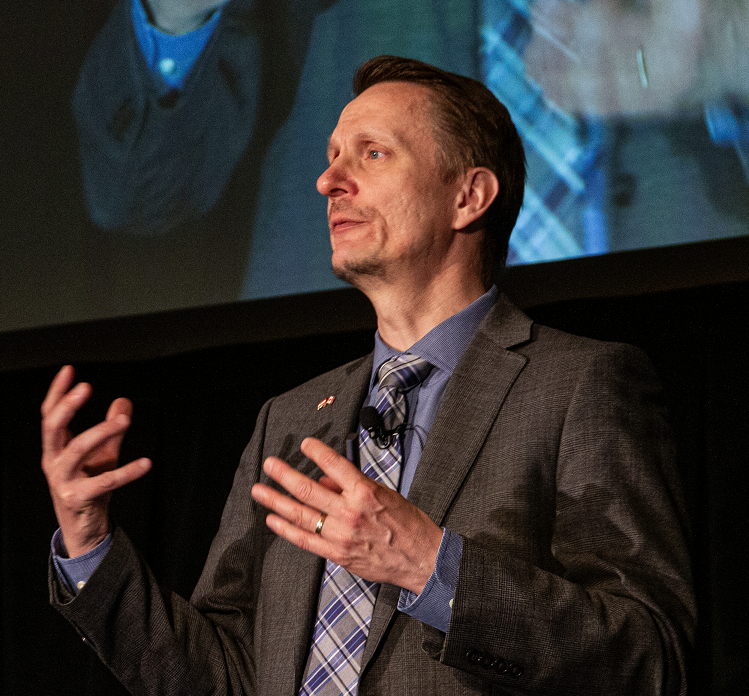
“The point at which all vehicle and track dynamics come together is the wheel/rail interface, that little contact patch about the size of a dime that you’ve heard about,” said Richard Stock, Global Head of Rail Solutions at Plasser & Theurer. Not matter how well the interface is designed, wear and damage are an intrinsic part of wheel/rail interaction. Like the wheel and the rail, wear and damage mechanisms are in constant interaction. Understanding and managing these interactions is an important part of wheel and rail maintenance and optimization.
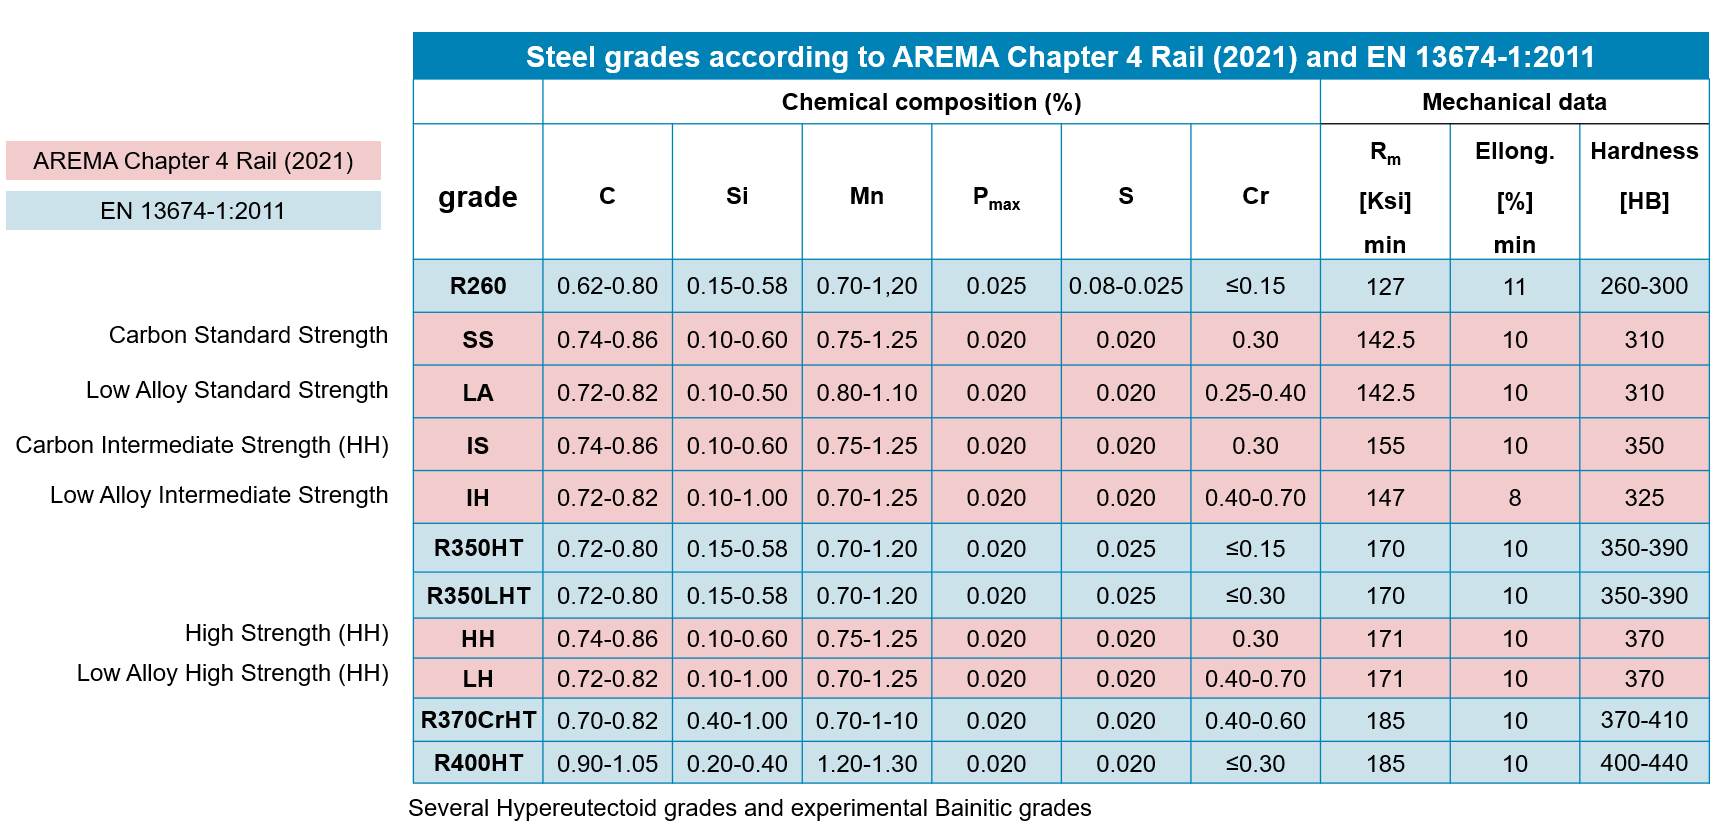
Contemporary rail steels range in hardness from 200 to 450 HB; wheels range from 200 to 415 HB. The pearlitic steel used to make wheels and rail is a two-phase material made of soft ferrite and hard cementite in a lamellar structure. It’s engineered to be hard (wear-resistant), tough (fracture resistant), and ductile (able to absorb stresses without breaking), Stock said. Figure 6 shows a table of available rail grades and their details.
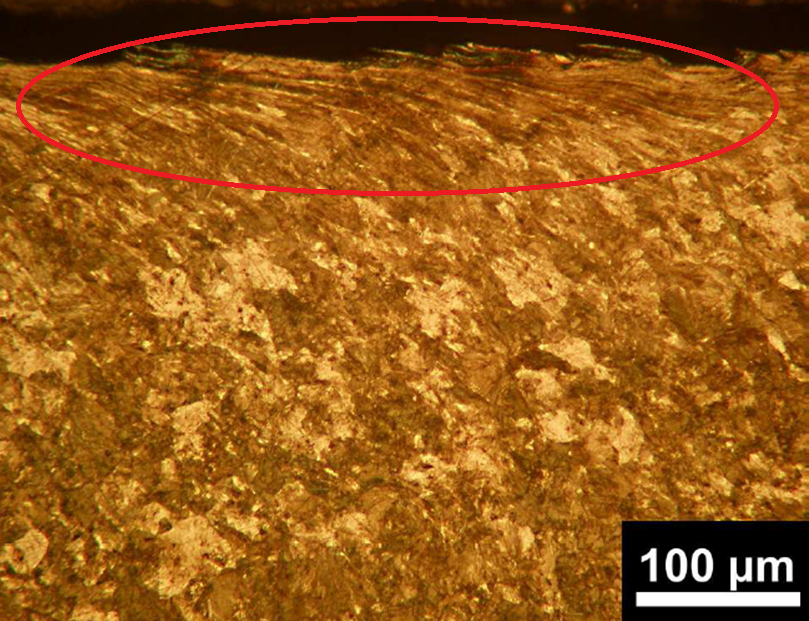
At lower stress states, steel exhibits elastic behavior, i.e., when the stress is removed, the steel has not accumulated any permanent strain, and returns to its original state. When stress exceeds the elastic material limit (elastic shakedown), the steel is strained and is plastically deformed, after which it returns to elastic behavior. Plastic deformation over many cycles, or ratchetting, deforms the surface of wheel and rail steel at (initially) microscopic level (see Figure 7).
As elastic/plastic deformation is occurring, so is wear: adhesive, abrasive, corrosive wear and fatigue all occur at the wheel/rail interface to some degree. Over time, and if left untreated, wear will significantly alter the wheel and rail profiles, severely impacting their interaction and contributing to further-accelerated wear and damage.
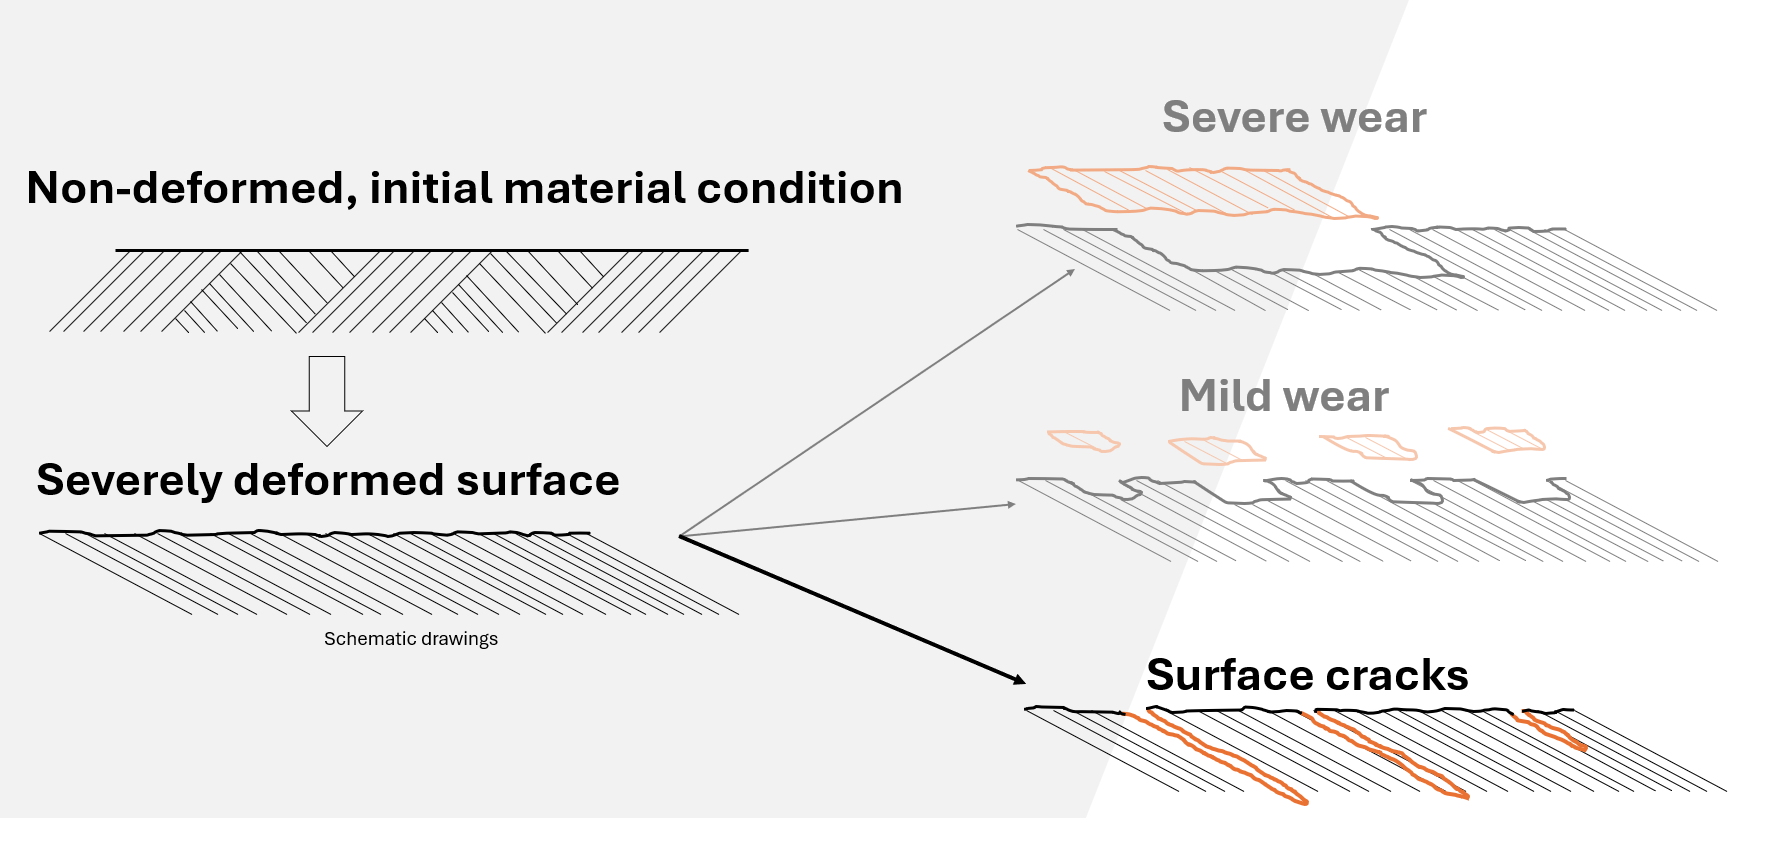
Under certain conditions, the deformed surface of the rail does not wear away to expose a new, non-deformed layer, but instead initiates a surface crack. “In this case, the crack does not cause material to break away from the surface [i.e., wear] but propagates into the material. The deformed microstructure provides a clear crack-path for the rail–a crack-growth highway in the direction of the lamellas,” Stock said (see Figure 8). This crack growth is known as rolling contact fatigue (RCF).
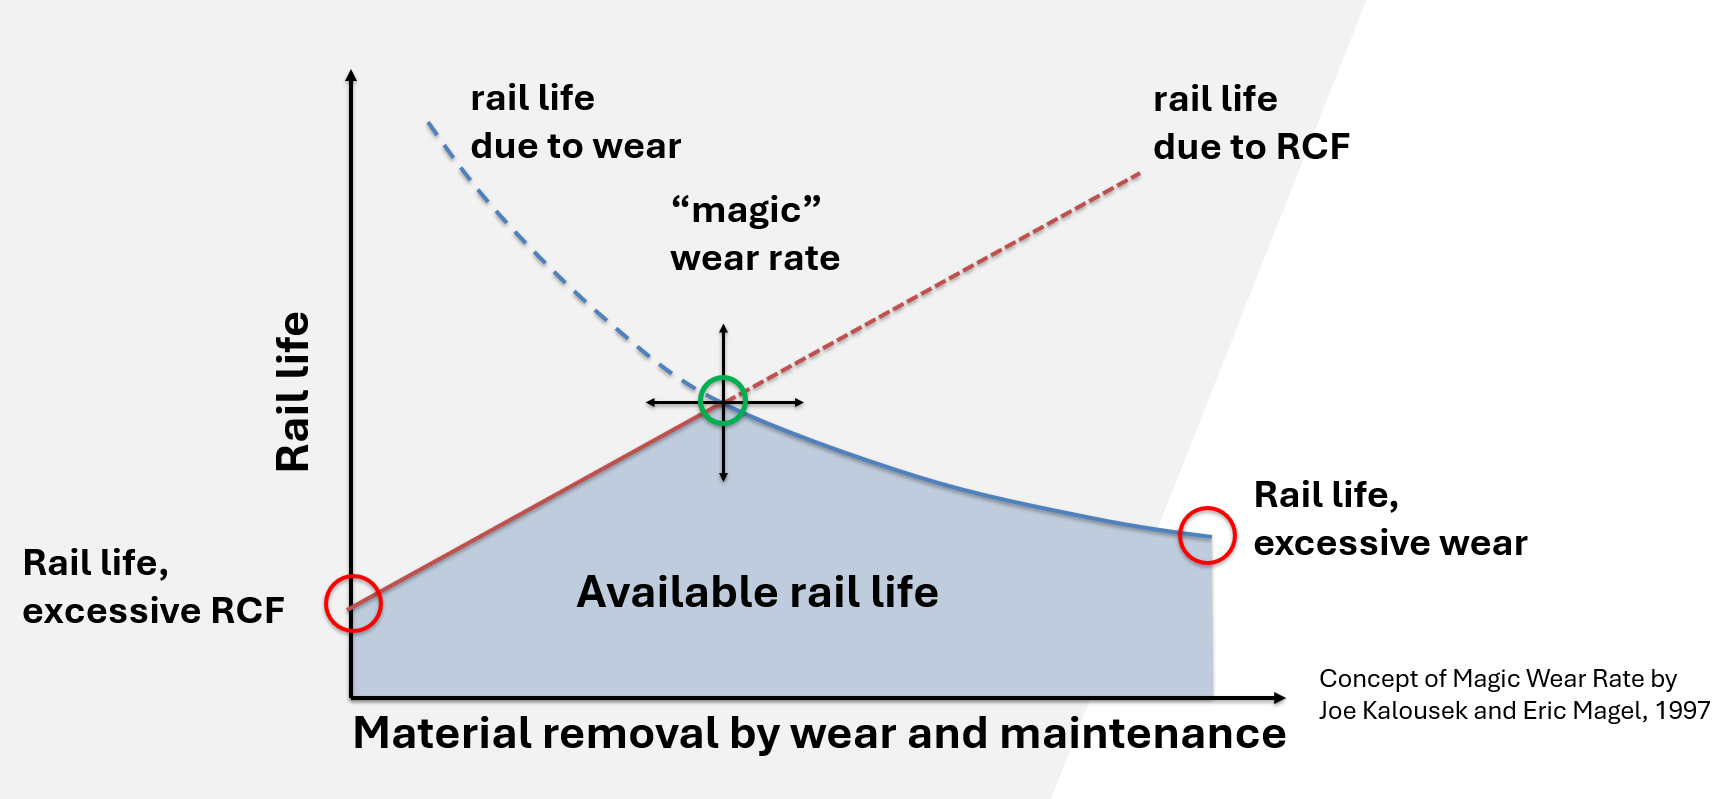
The balance between wear and incipient crack growth (RCF) is known as the magic wear rate (MWR). The MWR graph has a curve for theoretical rail life due to RCF on the x-axis, and material removal due to natural wear and maintenance (such as grinding) on the y-axis (see Figure 9). The area beneath the point where the two curves intersect shows potential available rail life. The point of intersection marks the peak potential rail: the magic wear rate.
The damage done by ratcheting and surface crack initiation can take on many forms, particularly as defects grow over time. Periodic cracks can appear at the gage corner, on the running surface of the rail. “These defects can, under certain conditions, lead to a detail fracture,” Stock said. The same periodic cracks can appear on wheels, for the same reasons. Flaking and spalling occur when surface cracks combine and cause small pieces of material to break off the rail. Shelling, in which large pieces of the gage corner break out of the rail, is initiated by cracking below the rail surface and is typically caused by high loading conditions. Squats are a defect characterized by a widened dip (typically kidney-shaped) in the running band. They’re evidenced by surface and subsurface cracks and develop slowly. If left untreated, they, too, can cause a rail break, he said.
In addition to the wear mechanisms already noted, the rail surface is also subject to tremendous thermal transfer, both in normal operations (traction and braking) and in the case of rail grinding maintenance activities. Thermal transformation of the rail surface leaves behind a very thin white etching layer (WEL). It’s a hard, brittle layer that typically wears away very quickly under normal operations. WELs are associated with squat-type defects (studs), which are superficially very similar to squats. They typically appear in clusters and can link together at a subsurface level to spall out large sections of the running band. Unlike squats, however, they are not associated with rail breaks. Of all defect types, studs are the least understood and remain a topic of ongoing research (see Studs: Squat-Type Defects that are Misunderstood and Mismanaged for more information), Stock said.
So, how do railroads mitigate wear and damage? Optimization and maintenance. Harder rail and wheel steels reduce systemwide wear and damage, Stock said. Optimized wheel and rail profiles help in many ways: they reduce contact stresses, evenly distribute wear, improve stability in tangent track, and steering in curves. Optimizing the friction between wheel and rail, i.e., the third-body layer, through the use of top-of-rail friction modifiers and gage-face lubrication can also greatly reduce wear and damage, and improve steering.
On the maintenance side, rail grinding and milling are the tools of the trade. Grinders (and milling machines) function by introducing “artificial wear” in that they remove rail material in order to reshape the rail to restore or implement optimal profiles and to remove surface damage before it progresses further. Similar to rail, wheels are re-trued (or lathed) for the same reasons.
“The first step of controlling damage to our rail and wheels is understanding the condition of our rail. We need to measure and quantify wear and damage,” Stock said.
Track and Vehicle Measurement Technologies
Measurement is the foundation of wheel/rail and vehicle/track optimization and maintenance. Measurement systems used in the industry have a come a long way since the days of the string line and protractor; the modern array of systems, equipment, and methods is expansive, but none of it is superfluous.
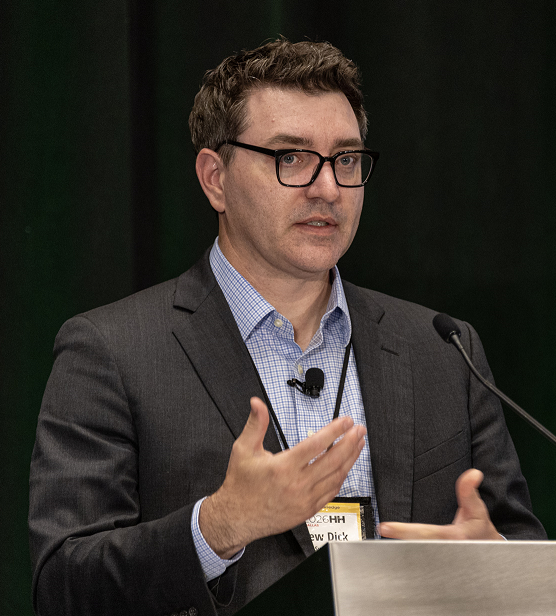
“When you boil it down, there are six categories [of measurement systems],” said Matt Dick, Head of Rail Strategy & Development at Engineering Systems, Inc. Systems that are:
- Mounted on the track to measure the track. This includes devices that monitor things like rail stress (strain gauges), or rail neutral temperature, and the like.
- Mounted on the track to measure the vehicle. These are wayside and track-mounted systems like wheel impact load detectors (WILDs), wheel profile measurement systems, and camera/machine vision systems.
- Mounted on the track to measure vehicle and track. An example of this is an L/V monitor, which measures the vertical and lateral forces imparted to the track by a passing vehicle/wheelset.
- Mounted on the vehicle to measure the track. These can be manned or unmanned vehicles that traverse the track to measure things like rail profile, track geometry, rail defects, and internal rail flaws.
- Mounted on the vehicle to measure vehicle and track. Instrumented wheelsets which measure dynamic wheel loads, and Vehicle/Track Interaction monitors which measure the vehicle response as it runs over the track.
Railroads use a combination of some or all of these technologies to measure their track, vehicle, and entire system conditions.
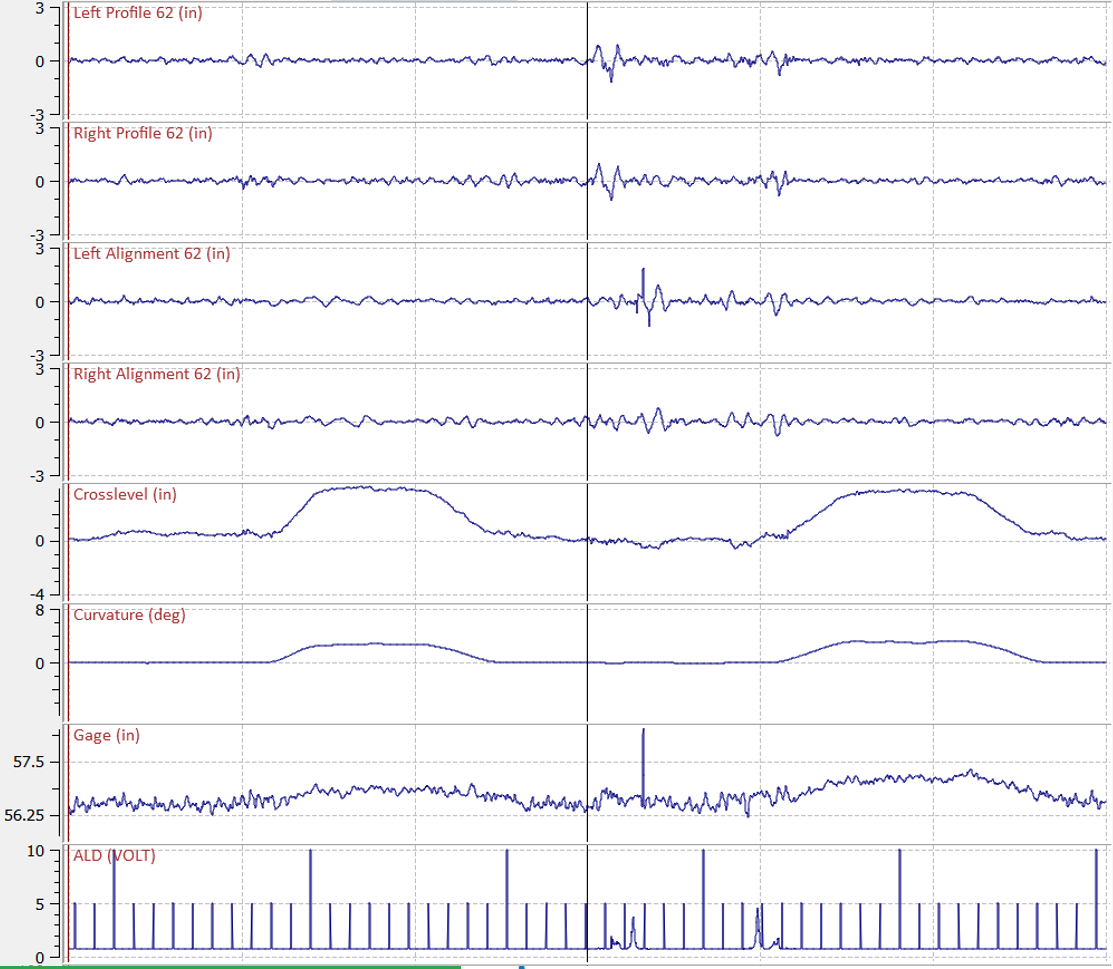
Geometry systems mounted on locomotives, coach cars or boxcars provide “loaded” measurements. Hi-rail vehicles, which weigh a fraction of the weight of a locomotive or loaded car, provide “unloaded” measurement. Measurement data from loaded vehicles can look quite different from unloaded vehicles. For example, gage is typically wider in curves under loaded conditions. This is largely due to much higher creep forces due to the higher vertical load, resulting in higher gage-spreading forces, Dick said. In general, weak track (regardless of whether the weakness is due to the fasteners, ties, or ballast) is more sensitive to differences in loaded versus unloaded measurement.
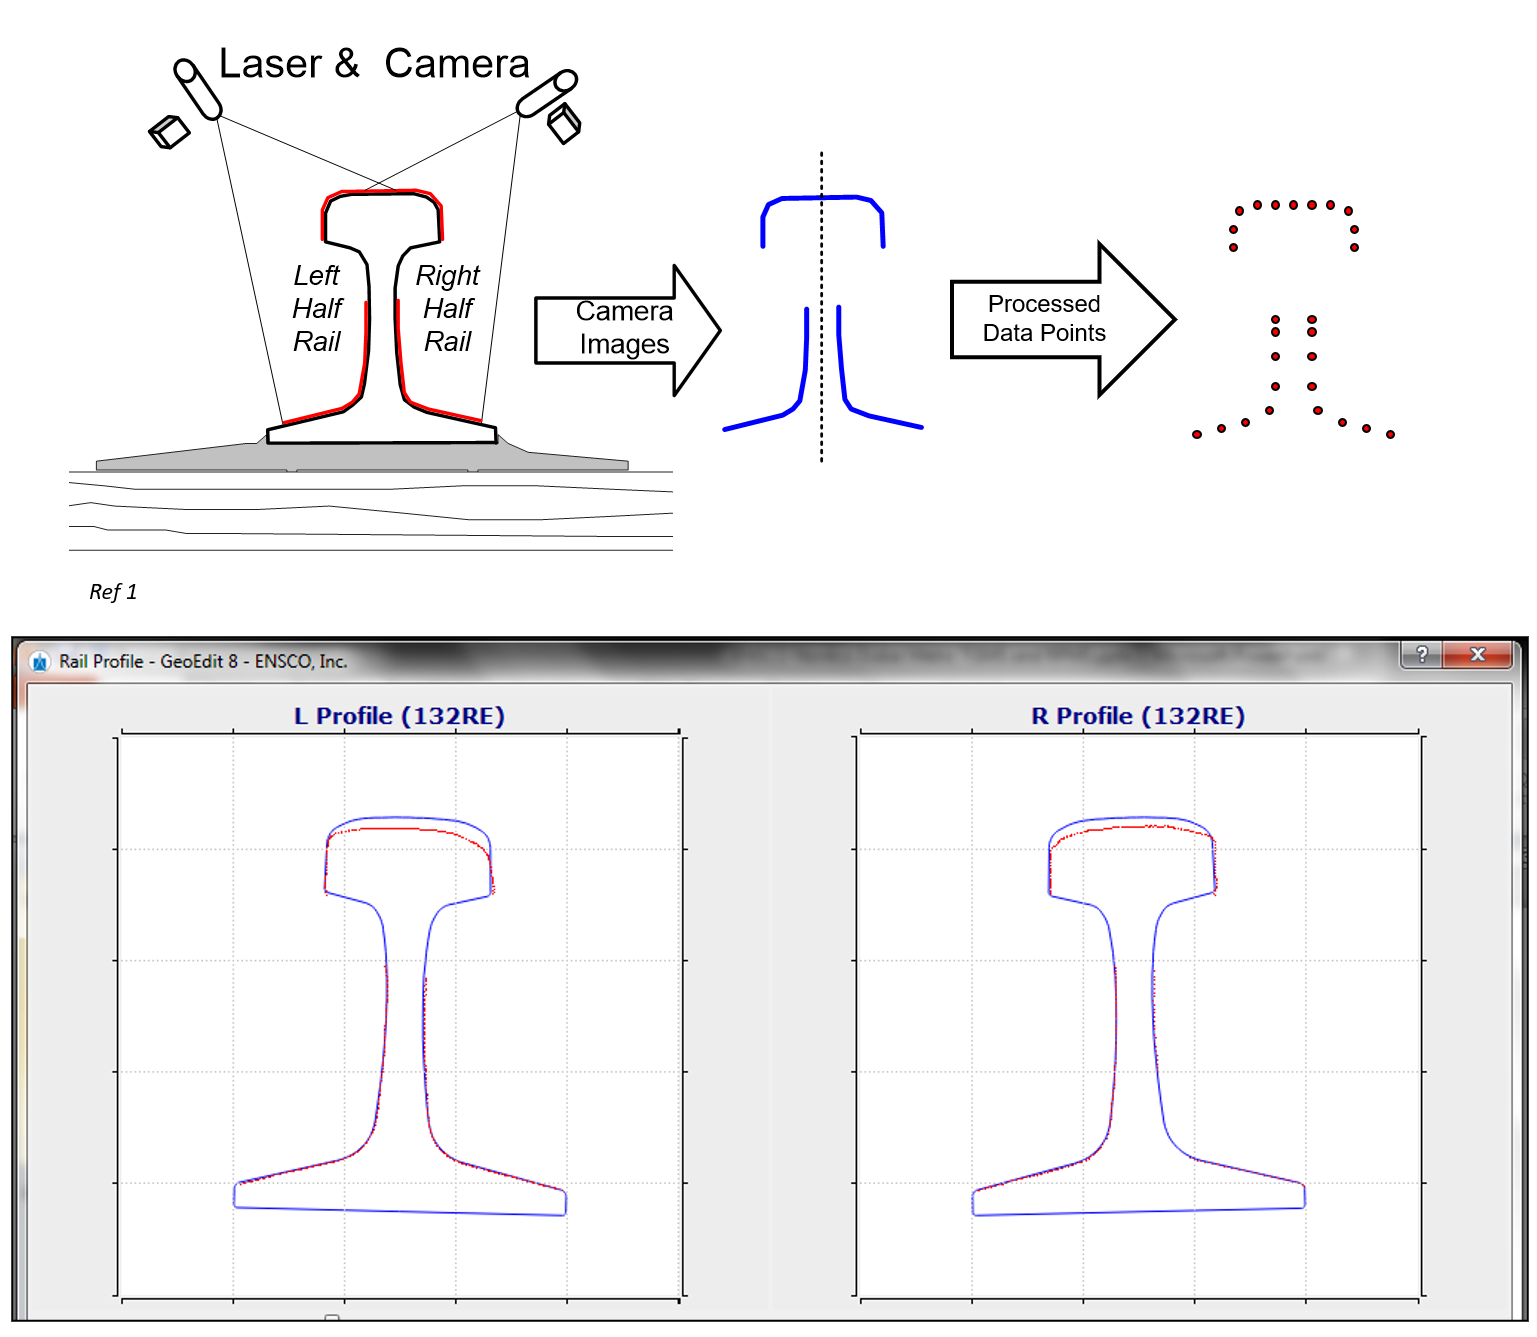
Rail (and wheel) profile measurement is also a standard practice in the industry. Often, profile and geometry data are collected in tandem—a practice that makes it easier to synchronize and align the data for further analysis. Profile measurement systems use lasers and cameras to collect a two-dimensional image of the rail at an adjustable interval (Figure 11 shows a diagram of profile measurement and measured profiles overlayed on new rail templates). Data collected from profile measurement is used to calculate vertical wear, head loss, gage and field wear, gage-face angle and gage and/or field lip. Wheel profile measurement systems work similarly, although these are usually wayside installations; each wheel is measured as cars pass through the site. From this data, flange height, flange thickness, rim thickness, and wheel back-to-back distances can be measured.
Wheel impact load detectors, or WILDs are wayside/track-mounted systems that use strain gauges to monitor rail stress over a length equal to or greater than the circumference of a wheel in order to detect high-impact wheels that can and will damage the track. WILD data is used to measure nominal load (in kips), peak load, dynamic load (peak minus nominal load), and the ratio of peak/nominal load, Dick said.
Machine vision (camera-type systems) has become a common part of the data railroads collect. In Part 1, the image showing abrasion on the side frame and springs of the first-to-derail car in the derailment case study was collected by a machine vision system. Machine vision is typically part of a wayside application, however, it is becoming increasingly common for vision systems to be mounted on autonomous vehicles as well, collecting data on things like rail surface, and tie and fastener condition.
Data from all the previously noted sources can also be used in derailment simulation to help determine the root cause of a derailment, Dick said. Train dynamics, such as braking and acceleration and buff and draft forces can be combined with vehicle/track interaction models. “In the model, you have to replicate the derailment. You have to make it do what it did in real life. If you don’t get that out of the model, it means you’re missing something.” Dick said.
Circling Back to the Derailment
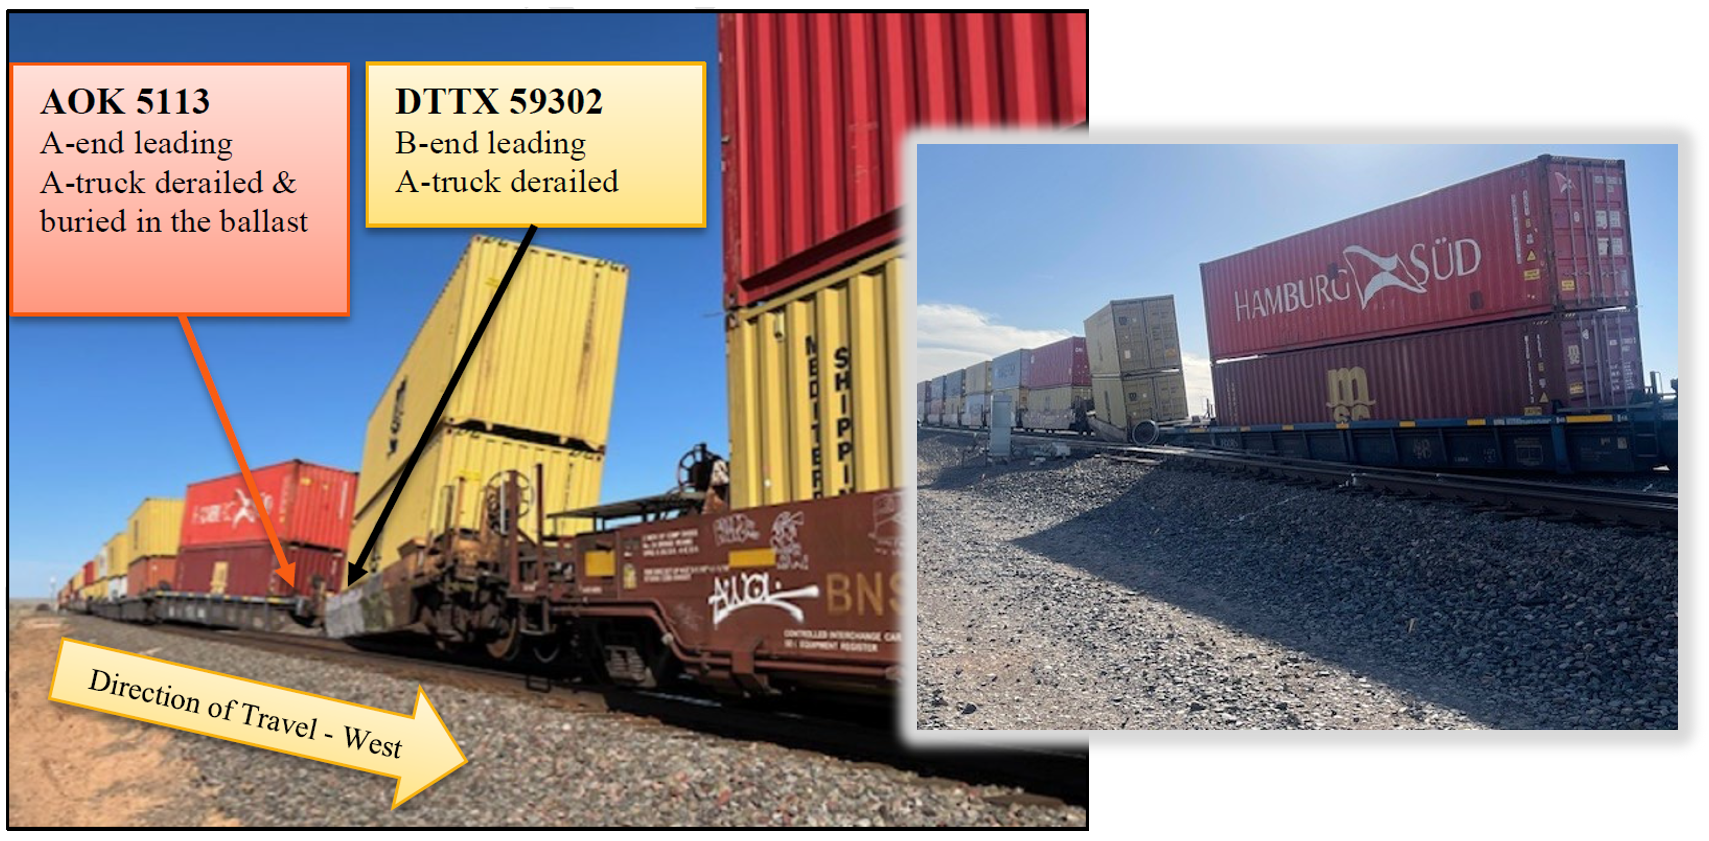
“Ninety percent of the data used to figure out the cause of the Case study derailment was available before the derailment occurred,” said David Casceli, Railroad Accident Investigator at the National Transportation Safety Board (NTSB), who moderated and led the discussion at the course.
Cognizant of the principles of wheel/rail interaction, what is the relevant data? he asked. Figure 12, for example, shows where the derailed cars came to rest. In addition to wheel marks on the ties and on the field side of the left (south) rail, damage to a road crossing and a frog indicate that the derailed car(s) were dragged for several miles.
The derailment type has already been identified as a wheel-climb derailment, meaning that some combination of factors caused the lead wheel on AOK 5113 to exceed the L/V threshold (a function of the wheel/rail contact angle and friction at the interface). “So, we’re looking for high lateral forces or a reduction in vertical forces, or both,” Casaceli said.
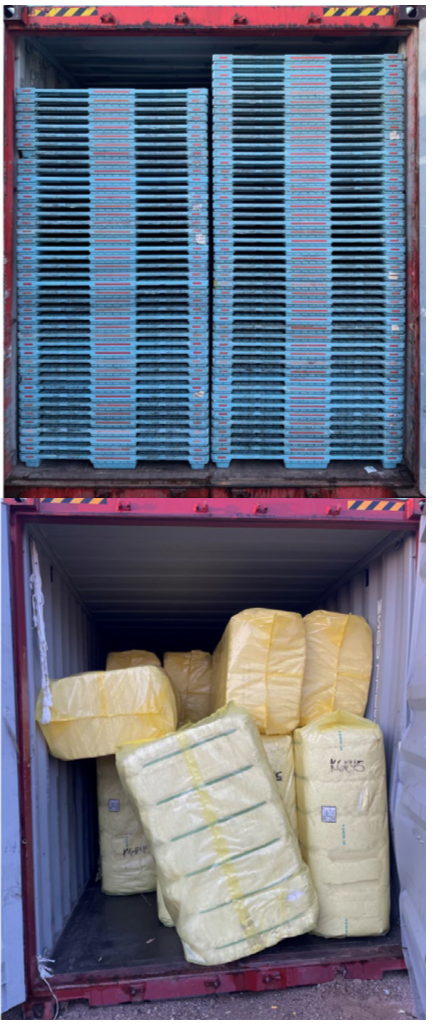
Figure 13 shows the lading of car AOK 5113 (top) and car DTTX 59302 (bottom). “You’ll notice that there’s load imbalance on the right side (the low rail side at the POD). This is a big clue that the vertical force on the high rail was likely reduced,” he said. There is also a high center, not so high that it exceeds the AAR threshold. but high, nonetheless. WILD data from the day prior to the derailment also showed that cat AOK 5113 leaned to the right (14%) then to the left (9%), indicating that load-shift has occurring, he said.
Despite the slight over-elevation of the curve at the POD, there are no geometry defects in advance of the area of the derailment. There is, however, a slight dip (½ in) in the low rail near the POD. Wheel and rail profiles show only slight wear, but nothing of obvious concern, Casaceli said.
Speed data from multiple trains shows that the accident train was travelling at an average speed, relative to other Westbound trains (see Figure 14). “Nonetheless, the slower you go on a curve with excess elevation, the more you unload the high rail,” Casaceli said. Vehicle dynamics simulations of the derailment show that, all factors combined, the high rail vertical wheel load at the POD would have been very low, about 80% lower than nominal conditions, he said.
Figure 15 shows a matrix of nominal and actual conditions at the POD, and, in the right column, each condition’s combined effect of the static vertical load on the wheel that climbed the rail. “Any one of these conditions, alone, and we’re still on the rail,” Casaceli said. “But put them all together, and we’re down to 10% load on that wheel.”
After all the bits of information were gathered and the data analyzed the investigators determined that the derailment was caused by a combination of factors. The study concluded that:
- Track surface and excess elevation had the greatest impact on vertical wheel load but was not sufficient to cause derailment.
- A load shift and truck suspension/steering degradation generated an elevated risk of wheel climb.
- The derailment also likely required conditions that were not simulated, such as: additional load shift or degradation of track surface or truck performance.
Due to the dynamic nature of load shift, the fact that the track geometry data for the POD was ≈2 weeks old, or some other unknown factor, the precise conditions at the time of the derailment are not known, Casaceli said. But the data shows that a combination of relatively minor issues on the track and vehicle side of the equation added up to a high enough L/V that a derailment did occur.
Examining the principles of wheel/interaction through the lens of a derailment investigation offers a one-of-a-kind, comprehensive view into the practical application or consequences of their mis-application in everyday railroading. But it does more than that, too. Understanding them, or even simply being cognizant of them, is to understand that a railroad is a single interconnected system. In the real world, wheels, rails, ballast, and train dynamics don’t exist in separate departmental silos. They all interact, all the time, through that dime-sized patch at the wheel/rail interface.

Jeff Tuzik is Managing Editor of Interface Journal
This article is based on presentations made at the 2026 Wheel/Rail Interaction Heavy Haul Principles of Wheel/Rail Interaction course.